
Introduction to charts
Displaying data in a chart or graph can make data interpretation much easier for users of the applications that you develop with Flex. Rather than present a simple table of numeric data, you can display a bar, pie, line, or other type of chart using colors, captions, and a two-dimensional representation of your data.
About charting
Data visualization lets you present data in a way that simplifies data interpretation and data relationships. Charting is one type of data visualization in which you create two-dimensional representations of your data. Flex supports the most common types of two-dimensional charts (such as bar, column, and pie charts) and gives you a great deal of control over the appearance of charts.
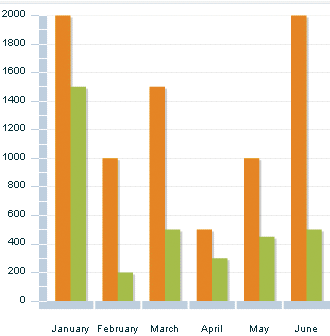
A simple chart shows a single data series, where a series is a group of related data points. For example, a data series might be monthly sales revenues or daily occupancy rates for a hotel.
Another chart might add a second data series. For example, you might include the percentage growth of profits over the same four business quarters. The following chart shows two data series—one for sales and one for profit.
Using the charting controls
Flex charting controls lets you create some of the most common chart types, and also lets you customize the appearance of your charts. The charting controls are located in the mx.charts.* package.
The following table lists the supported chart types, the name of the control class, and the name of the series class that you use to define what data appears in each chart.
|
Chart type |
Chart control class |
Chart series class |
|---|---|---|
|
Area |
||
|
Bar |
||
|
Bubble |
||
|
Candlestick |
||
|
Column |
||
|
HighLowOpenClose |
||
|
Line |
||
|
Pie |
||
|
Plot |
All chart controls, except the PieChart class, are subclasses of the CartesianChart class. Cartesian charts are charts that typically represent a set of data points in rectangular-shaped, two-dimensional space. The PieChart class is a subclass of the PolarChart class, which represents data in circular space.
All chart controls inherit basic charting characteristics from the ChartBase class.
A chart control typically has the following structure in MXML:
 <mx:chart_type>
 	<!-- Define one or more series. -->
 	<mx:series>
		<mx:Series1/>
		...
	</mx:series>

 	<!-- Define the axes. -->
 	<mx:horizontalAxis>
 		<mx:axis_type/>
 	</mx:horizontalAxis>
 	<mx:verticalAxis>
 		<mx:axis_type/>
 	</mx:verticalAxis>

 	<!-- Style the axes and ticks marks. -->
 	<mx:horizontalAxisRenderers>
 		<mx:AxisRenderer/>
 	</mx:horizontalAxisRenderers>
 	<mx:verticalAxisRenderers>
 		<mx:AxisRenderer/>
 	</mx:verticalAxisRenderers/>

 	<!-- Add grid lines and other elements to the chart. -->
 	<mx:annotationElements>
 		<array of elements/>
 	</mx:annotationElements>
 	<mx:backgroundElements>
 		<array of elements/>
 	</mx:backgroundElements/>
 </mx:chart_type>

 <!-- Optionally define the legend. -->
 <mx:Legend/>
The following table describes the parts of the chart in more detail:
|
Part |
Description |
|---|---|
|
Chart |
(Required) Defines a data provider for the chart. Also defines the chart type and sets data tips, mouse sensitivity, gutter styles, and axis styles. This is the top-level tag for a chart control. All other tags are child tags of this tag. |
|
Series |
(Required) Defines one or more data series to be displayed on the chart. Also sets the strokes, fills, and renderers (or skins) of the data series, as well as the strokes and fills used by the chart's legend for each series. You can use different series types in the same chart. Each series in a chart can have its own data provider, or they can share the data provider set on the chart object. |
|
Axes |
Sets the axis type (numeric or category) for each axis. Also defines the axis labels, titles, and style properties such as padding. |
|
Axes renderers |
(Optional) Sets tick placement and styles, enables or disables labels, and defines axis lines, label rotation, and label gap. |
|
Elements |
(Optional) Defines grid lines and extra elements to appear on the chart. |
For each chart type, Flex supplies a corresponding chart control and chart series. The chart control defines the chart type, the data provider that supplies the chart data, the grid lines, the text for the chart axes, and other properties specific to the chart type. The dataProvider property of the chart control determines what data the chart uses.
A data provider is a collection of objects. It can be an Array of objects or any object that implements the collections API. A data provider can also be an XMLList object with XML nodes, such as the result of an E4X query.
The chart components use a flat, or list-based, data provider similar to a one-dimensional array. The data provider can contain objects such as Strings and Numbers, or even other objects. For more information on supplying chart data, see Defining chart data.
You use the chart series to identify which data from the data provider the chart displays. A data provider can contain more data than you want to show in your chart, so you use the chart's series to specify which points you want to use from the data provider. You can specify more than one series. You can also use the chart series to define the appearance of the data in the chart.
All chart series inherit the data provider from the chart unless they have a data provider explicitly set on themselves. If you set the value of the dataProvider property on the chart control, you are not required to set the property value on the series. You can, however, define different data providers for each series in a chart.
For example, to create a pie chart, you use the PieChart control with the PieSeries chart series. To create an area chart, you use the AreaChart control with the AreaSeries chart series, as the following example shows:
<?xml version="1.0"?>
<!-- charts/BasicAreaOneSeries.mxml -->
<s:Application
    xmlns:fx="http://ns.adobe.com/mxml/2009"
    xmlns:mx="library://ns.adobe.com/flex/mx"
    xmlns:s="library://ns.adobe.com/flex/spark"
    height="600">


<fx:Script><![CDATA[


import mx.collections.ArrayCollection;


[Bindable]


public var expenses:ArrayCollection = new ArrayCollection([


{Month:"Jan", Profit:2000, Expenses:1500, Amount:450},


{Month:"Feb", Profit:1000, Expenses:200, Amount:600},


{Month:"Mar", Profit:1500, Expenses:500, Amount:300}


]);

]]></fx:Script>

    <s:layout>
        <s:VerticalLayout/>
    </s:layout>

  <s:Panel title="Area Chart">
        <s:layout>
            <s:VerticalLayout/>
        </s:layout>
     <mx:AreaChart id="myChart" dataProvider="{expenses}"
     showDataTips="true">
        <mx:horizontalAxis>
           <mx:CategoryAxis
                dataProvider="{expenses}"
                categoryField="Month"/>
        </mx:horizontalAxis>
        <mx:series>
           <mx:AreaSeries
                yField="Profit"
                displayName="Profit"/>
        </mx:series>
     </mx:AreaChart>
     <mx:Legend dataProvider="{myChart}"/>
  </s:Panel>
</s:Application>
This example defines an array containing a single <mx:AreaSeries> tag. The <mx:AreaSeries> tag specifies the single data series that is displayed in the chart.
You can add a second <mx:AreaSeries> tag to display two data series, as the following example shows:
<?xml version="1.0"?>
<!-- charts/BasicArea.mxml -->
<s:Application
    xmlns:fx="http://ns.adobe.com/mxml/2009"
    xmlns:mx="library://ns.adobe.com/flex/mx"
    xmlns:s="library://ns.adobe.com/flex/spark"
    creationComplete="srv.send()"
    height="600">

    <fx:Declarations>
        <!-- View source of the following page to see the structure of the data that Flex uses in this example. -->
        <mx:HTTPService id="srv" url="http://examplesserver/chart_examples/expenses-xml.aspx"/>
        <!-- To see data in an HTML table, go to http://examplesserver/chart_examples/expenses.aspx -->
    </fx:Declarations>

    <s:layout>
        <s:VerticalLayout/>
    </s:layout>

  <s:Panel title="Area Chart">
      <s:layout>
          <s:VerticalLayout/>
      </s:layout>
     <mx:AreaChart id="myChart"
        showDataTips="true"
        dataProvider="{srv.lastResult.data.result}">
        <mx:horizontalAxis>
           <mx:CategoryAxis
               categoryField="month"
               displayName="Month"/>
        </mx:horizontalAxis>
        <mx:series>
           <mx:AreaSeries yField="profit" displayName="Profit"/>
           <mx:AreaSeries yField="expenses" displayName="Expenses"/>
        </mx:series>
     </mx:AreaChart>
     <mx:Legend dataProvider="{myChart}"/>
  </s:Panel>
</s:Application>
You are not required to define a data provider on the chart control itself. Instead, you can define a different data provider for each element in a chart control that requires one. Each series can have its own data provider, as well as each axis, as the following example shows:
<?xml version="1.0"?>
<!-- charts/MultipleDataProviders.mxml -->
<s:Application
    xmlns:fx="http://ns.adobe.com/mxml/2009"
    xmlns:mx="library://ns.adobe.com/flex/mx"
    xmlns:s="library://ns.adobe.com/flex/spark"
    height="600">

  <fx:Script><![CDATA[
     import mx.collections.ArrayCollection;
     [Bindable]
     public var profit04:ArrayCollection = new ArrayCollection([
        {Month:"Jan", Profit:2000},
        {Month:"Feb", Profit:1000},
        {Month:"Mar", Profit:1500}
     ]);
     [Bindable]
     public var profit05:ArrayCollection = new ArrayCollection([
        {Month:"Jan", Profit:2200},
        {Month:"Feb", Profit:1200},
        {Month:"Mar", Profit:1700}
     ]);
     [Bindable]
     public var profit06:ArrayCollection = new ArrayCollection([
        {Month:"Jan", Profit:2400},
        {Month:"Feb", Profit:1400},
        {Month:"Mar", Profit:1900}
     ]);
  ]]></fx:Script>

    <s:layout>
        <s:VerticalLayout/>
    </s:layout>

  <s:Panel title="Column Chart">
     <s:layout>
         <s:VerticalLayout/>
     </s:layout>
     <mx:ColumnChart id="myChart" showDataTips="true">
        <mx:horizontalAxis>
           <mx:CategoryAxis dataProvider="{profit04}" categoryField="Month"/>
        </mx:horizontalAxis>
        <mx:series>
           <mx:ColumnSeries
                dataProvider="{profit04}"
                yField="Profit"
                xField="Month"
                displayName="2004"/>
           <mx:ColumnSeries
                dataProvider="{profit05}"
                yField="Profit"
                xField="Month"
                displayName="2005"/>
           <mx:ColumnSeries
                dataProvider="{profit06}"
                yField="Profit"
                xField="Month"
                displayName="2006"/>
        </mx:series>
     </mx:ColumnChart>
     <mx:Legend dataProvider="{myChart}"/>
  </s:Panel>
</s:Application>
To dynamically size the chart to the size of its container, set the width and height attributes to a percentage value, as the following example shows:
<?xml version="1.0"?>
<!-- charts/BasicBarSize.mxml -->
<s:Application
    xmlns:fx="http://ns.adobe.com/mxml/2009"
    xmlns:mx="library://ns.adobe.com/flex/mx"
    xmlns:s="library://ns.adobe.com/flex/spark"
    height="600">

    <s:layout>
        <s:VerticalLayout/>
    </s:layout>

  <fx:Script>
    <![CDATA[
     import mx.collections.ArrayCollection;
     [Bindable]
     public var expenses:ArrayCollection = new ArrayCollection([
        {Month:"Jan", Profit:2000, Expenses:1500},
        {Month:"Feb", Profit:1000, Expenses:200},
        {Month:"Mar", Profit:1500, Expenses:500}
     ]);
    ]]>
  </fx:Script>

     <mx:BarChart id="myChart"
        dataProvider="{expenses}"
        height="100%"
        width="100%"
        showDataTips="true">
        <mx:verticalAxis>
           <mx:CategoryAxis
                dataProvider="{expenses}"
                categoryField="Month"/>
        </mx:verticalAxis>
        <mx:series>
           <mx:BarSeries
                yField="Month"
                xField="Profit"
                displayName="Profit"/>
           <mx:BarSeries
                yField="Month"
                xField="Expenses"
                displayName="Expenses"/>
        </mx:series>
     </mx:BarChart>
     <mx:Legend dataProvider="{myChart}"/>
</s:Application>
If the chart is inside a container (such as a Panel), set the size of the chart's parent containers to percentage values too.
About the series classes
The chart series classes let you specify what data to render in a chart control. All series classes are subclasses of the Series class.
Each chart type has its own series class; for example, a BarChart control has a BarSeries class that defines the data to render in the BarChart. A PieChart control has a PieSeries.
The primary purpose of a series is to define what data to render in the chart. You use the series to define what field in a data provider the chart should use to render chart items on the X and Y axes. You use the xField property (for the horizontal axis) and the yField property (for the vertical axis) to define these fields.
Each series is made up of an Array of series items. The classes that define the series items are specific to each series type. For example, a BarSeries is made up of BarSeriesItem objects. A ColumnSeries is made up of ColumnSeriesItem objects. The series items encapsulate all the information about the particular data point, including the minimum value, the x value, and the y value.
When you create a new series, you typically define the displayName of that series. This property represents the series to the user in labels such as DataTip objects.
A BarChart typically specifies one or more BarSeries objects that define what set of bars to render in the chart. By default, bars and columns are clustered. However, you can also define alternate ways to group, or "stack", series in the chart control. For example, AreaSeries, ColumnSeries, and BarSeries can be stacked or overlaid. They can also render as 100% charts. You can further control how multiple series are grouped by using sets. For example, for a group of BarSeries objects, you use the BarSet class; for a group of ColumnSeries objects, you use the ColumnSet class. For more information on grouping series, see Stacking charts.
Most charts use only one kind of series. However, you can specify multiple types of series for a chart. For example, you can create a chart that has a series of bars in addition to a trend line that "floats" over it. This is useful for rendering trend-lines or showing different types of data on a single chart for comparison analysis. For more information, see Using multiple data series.
You use the series classes to define the appearance of the chart items. You can change the fill of all series items by using the fill property on the series. In addition, you can define the fill of each item in a series by using the fills property. You can also customize the fill that each chart item has based on its value by using the fillFunction on the series. For more information Using fills with chart controls.
You can also apply filters to series to give them effects such as drop shadows, blurs, and glows. For more information, see Using filters with chart controls.
You can add data labels to series items. You do this by setting the value of the labelPosition property on the series. For most series, possible values of labelPosition are inside and outside, which draw the labels inside the chart item and outside the chart item, respectively. For a PieSeries, you can also set the labelPosition property to other values that include callout and insideWithCallout.
You can customize data labels by using a labelFunction. This callback function takes arguments that define the series item and returns a String that is then rendered on the series item.
For information about adding data labels to your charts, see Using data labels.
Series also let you set a minField value. This property lets you specify a minimum value that the series displays. For more information, see Using the minField property.
About the axis classes
Flex charting controls support the following types of axes:
- CategoryAxis
-
CategoryAxis class maps a set of values (such as stock ticker symbols, state names, or demographic categories) to the axis. You use the <mx:CategoryAxis> tag to define axis labels that are grouped by logical associations and that are not necessarily numeric. For example, the month names used in the chart in About charting could be defined as a CategoryAxis class.
- LinearAxis
-
A LinearAxis class maps numeric data to the axis. You use the <mx:LinearAxis> child tag of the <mx:horizontalAxis> or <mx:verticalAxis> tags to customize the range of values displayed along the axis, and to set the increment between the axis labels of the tick marks.
- LogAxis
-
A LogAxis class maps numeric data to the axis logarithmically. You use the <mx:LogAxis> child tag of the <mx:horizontalAxis> or <mx:verticalAxis> tags. Labels on the logarithmic axis are even powers of 10.
- DateTimeAxis
-
A DateTimeAxis class maps time-based values, such as hours, days, weeks, or years, along a chart axis. You use the <mx:DateTimeAxis> tag to define the axis labels.
The DateTimeAxis, LogAxis, and LinearAxis are all of type NumericAxis, because they are used to represent numeric values. In many cases, you are required to define only one axis as being a NumericAxis or a CategoryAxis. Flex assumes that all axes not explicitly defined are of type LinearAxis. However, to use decorations such as DataTip labels and legends, you might be required to explicitly define both axes.
There are exceptions. For a PlotChart control, both axes are considered a LinearAxis, because the data point is the intersection of two coordinates. So, you are not required to specify either axis, although you can do so to provide additional settings, such as minimum and maximum values. When you create PieChart controls, you also do not specify either axis, because PieChart controls use a single set of data points to draw wedges that represent a percentage of the whole. In PieChart controls, you define a nameField on the chart's data series, rather than a categoryField or name on the axes for labels and legends.
Each axis can have one or more corresponding AxisRenderer objects (specified by the horizontalAxisRenderers or verticalAxisRenderers properties) that define the appearance of axis labels and tick marks. In addition to defining formats, you can use an AxisRenderer class to customize the value of the axis labels. For more information, see Formatting charts.
The appearance and contents of axis labels are defined by the <mx:horizontalAxis> (x-axis) and <mx:verticalAxis> (y-axis) tags and the renderers for these tags (<mx:AxisRenderer> tags within the <mx:horizontalAxisRenderers> and <mx:verticalAxisRenderers> tags). These tags not only define the data ranges that appear in the chart, but also map the data points to their names and labels. This mapping has a large impact on how the Data Management Service chart renders the values of DataTip labels, axis labels, and tick marks.
By default, Flex uses the chart type and orientation to calculate the labels that appear along the x-axis and y-axis of the chart. The labels of a column chart, for example, have the following default values:
- The x-axis
-
The minimum number of labels is 0, and the maximum is the number of items in the data series that is being charted.
- The y-axis
-
The minimum value on the y-axis is small enough for the chart data, and the maximum value is large enough based to accomodate the chart data.
For more information about chart axes, see Working with axes.
About charting events
The chart controls include events that accommodate user interaction with data points in charts. These events are described in Events and effects in charts.
Creating charts in ActionScript
You can create, destroy, and manipulate charts using ActionScript just as you can any other Flex component.
When working in Script blocks or in separate ActionScript class files, you must be sure to import all appropriate classes. The following set of import statements defines the most common cases:
 import mx.collections.*;
 import mx.charts.*;
 import mx.charts.series.*;
 import mx.charts.renderers.*;
 import mx.charts.events.*;
To create a chart in ActionScript, use the new keyword. You can set properties on the chart object as you would in MXML. You assign a data provider with the dataProvider property. To add a data series to the chart, you define a new data series of the appropriate type. To apply the series to your chart, use the chart's series property. You can specify the category axis settings using the CategoryAxis class. The following example defines a BarChart control with two series:
<?xml version="1.0"?>
<!-- charts/CreateChartInActionScript.mxml -->
<s:Application
    xmlns:fx="http://ns.adobe.com/mxml/2009"
    xmlns:mx="library://ns.adobe.com/flex/mx"
    xmlns:s="library://ns.adobe.com/flex/spark"
    creationComplete="init()"
    height="600">

    <s:layout>
        <s:VerticalLayout/>
    </s:layout>

  <fx:Script><![CDATA[
     import mx.collections.ArrayCollection;
     import mx.charts.BarChart;
     import mx.charts.series.BarSeries;
     import mx.charts.CategoryAxis;
     import mx.charts.Legend;

     [Bindable]
     public var expenses:ArrayCollection = new ArrayCollection([
        {Month:"Jan", Profit:2000, Expenses:1500},
        {Month:"Feb", Profit:1000, Expenses:200},
        {Month:"Mar", Profit:1500, Expenses:500}
     ]);

     public var myChart:BarChart;
     public var series1:BarSeries;
     public var series2:BarSeries;
     public var legend1:Legend;

     public function init():void {
        /* Create the chart object and set some
           basic properties. */
        myChart = new BarChart();
        myChart.showDataTips = true;
        myChart.dataProvider = expenses;

        /* Define the category axis. */
        var vAxis:CategoryAxis = new CategoryAxis();
        vAxis.categoryField = "Month" ;
        vAxis.dataProvider =  expenses;
        myChart.verticalAxis = vAxis;

        /* Add the series. */
        var mySeries:Array=new Array();
        series1 = new BarSeries();
        series1.xField="Profit";
        series1.yField="Month";
        series1.displayName = "Profit";
        mySeries.push(series1);

        series2 = new BarSeries();
        series2.xField="Expenses";
        series2.yField="Month";
        series2.displayName = "Expenses";
        mySeries.push(series2);

        myChart.series = mySeries;

        /* Create a legend. */
        legend1 = new Legend();
        legend1.dataProvider = myChart;

        /* Attach chart and legend to the display list. */
        p1.addElement(myChart);
        p1.addElement(legend1);
     }
  ]]></fx:Script>

  <s:Panel id="p1" title="BarChart Created in ActionScript">
    <s:layout>
        <s:VerticalLayout/>
    </s:layout>
  </s:Panel>
</s:Application>
This example replaces the existing Array of series with the new series.
You can use a similar technique to add data series to your charts rather than replacing the existing ones. The following example creates two ColumnSeries and sets their data providers. It then creates an Array that holds the existing chart series, and pushes the new series into that Array. Finally, it sets the value of the chart's series property to be the new Array of series.
<?xml version="1.0"?>
<!-- charts/AddingSeries.mxml -->
<s:Application
    xmlns:fx="http://ns.adobe.com/mxml/2009"
    xmlns:mx="library://ns.adobe.com/flex/mx"
    xmlns:s="library://ns.adobe.com/flex/spark"
    creationComplete="srv_fred.send();srv_fe.send();srv_strk.send();"
    height="600">

    <fx:Declarations>
         <!-- To see data in an HTML table, go to http://examplesserver/chart_examples/stocks.aspx -->
         <!-- View source of the following pages to see the structure of the data that Flex uses in this example. -->
         <mx:HTTPService id="srv_fred" url="http://examplesserver/chart_examples/stocks-xml.aspx?tickerSymbol=FRED"/>
         <mx:HTTPService id="srv_fe" url="http://examplesserver/chart_examples/stocks-xml.aspx?tickerSymbol=FE"/>
         <mx:HTTPService id="srv_strk" url="http://examplesserver/chart_examples/stocks-xml.aspx?tickerSymbol=STRK"/>
    </fx:Declarations>

    <s:layout>
        <s:VerticalLayout/>
    </s:layout>

    <fx:Script><![CDATA[
        import mx.charts.series.ColumnSeries;
        import mx.collections.ArrayCollection;

        private var series1:ColumnSeries;
        private var series2:ColumnSeries;

        private function addMoreSeries():void {
            if (!series1 || !series2) {
                series1 = new ColumnSeries();
                series1.dataProvider = srv_fe.lastResult.data.result;
                series1.yField = "close";
                series1.xField = "date";
                series1.displayName = "FE";

                series2 = new ColumnSeries();
                series2.dataProvider = srv_strk.lastResult.data.result;
                series2.yField = "close";
                series2.xField = "date";
                series2.displayName = "STRK";

                var currentSeries:Array = myChart.series;

                currentSeries.push(series1);
                currentSeries.push(series2);

                myChart.series = currentSeries;
            }
        }

        private function resetApp():void {
            myChart.series = [ series0 ];
            series1 = null;
            series2 = null;
        }
    ]]></fx:Script>

    <s:Panel title="Column Chart">
        <s:layout>
            <s:VerticalLayout/>
        </s:layout>
        <mx:ColumnChart id="myChart" showDataTips="true">
            <mx:horizontalAxis>
                <mx:DateTimeAxis dataUnits="days"/>
            </mx:horizontalAxis>
            <mx:series>
                <mx:ColumnSeries dataProvider="{srv_fred.lastResult.data.result}"
                    id="series0"
                    yField="close"
                    xField="date"
                    displayName="FRED"/>
            </mx:series>
        </mx:ColumnChart>
        <mx:Legend dataProvider="{myChart}"/>
    </s:Panel>
    <s:HGroup>
        <s:Button id="b1" label="Add More Series To Chart" click="addMoreSeries()"/>
        <s:Button id="b2" label="Reset" click="resetApp()"/>
    </s:HGroup>
</s:Application>
By using ActionScript, you can also define a variable number of series for your charts. The following example uses E4X syntax to extract an Array of unique names from the data. It then iterates over this Array and builds a new LineSeries for each name.
<?xml version="1.0"?>
<!-- charts/VariableSeries.mxml -->
<s:Application
    xmlns:fx="http://ns.adobe.com/mxml/2009"
    xmlns:mx="library://ns.adobe.com/flex/mx"
    xmlns:s="library://ns.adobe.com/flex/spark"
    creationComplete="initApp();"
    height="600">

  <fx:Script><![CDATA[
        import mx.charts.series.LineSeries;
        import mx.charts.DateTimeAxis;

        [Bindable]
        private var myXML:XML =
            <dataset>
            <item>
                <who>Tom</who>
                <when>08/22/2006</when>
                <hours>5.5</hours>
            </item>
            <item>
                <who>Tom</who>
                <when>08/23/2006</when>
                <hours>6</hours>
            </item>
            <item>
                <who>Tom</who>
                <when>08/24/2006</when>
                <hours>4.75</hours>
            </item>
            <item>
                <who>Dick</who>
                <when>08/22/2006</when>
                <hours>6</hours>
            </item>
            <item>
                <who>Dick</who>
                <when>08/23/2006</when>
                <hours>8</hours>
            </item>
            <item>
                <who>Dick</who>
                <when>08/24/2006</when>
                <hours>7.25</hours>
            </item>
            <item>
                <who>Jane</who>
                <when>08/22/2006</when>
                <hours>6.5</hours>
            </item>
            <item>
                <who>Jane</who>
                <when>08/23/2006</when>
                <hours>9</hours>
            </item>
            <item>
                <who>Jane</who>
                <when>08/24/2006</when>
                <hours>3.75</hours>
            </item>
            </dataset>;

        public function initApp():void {
            var wholist:Array = new Array();
            for each(var property:XML in myXML.item.who) {
                // Create an Array of unique names.
                if (wholist[property] != property)
                    wholist[property] = property;
            }

            // Iterate over names and create a new series
            // for each one.
            for (var s:String in wholist) {
                // Use all items whose name matches s.
                var localXML:XMLList = myXML.item.(who==s);

                // Create the new series and set its properties.
                var localSeries:LineSeries = new LineSeries();
                localSeries.dataProvider = localXML;
                localSeries.yField = "hours";
                localSeries.xField = "when";

                // Set values that show up in dataTips and Legend.
                localSeries.displayName = s;

                // Back up the current series on the chart.
                var currentSeries:Array = myChart.series;
                // Add the new series to the current Array of series.
                currentSeries.push(localSeries);
                // Add the new Array of series to the chart.
                myChart.series = currentSeries;
            }

            // Create a DateTimeAxis horizontal axis.
            var hAxis:DateTimeAxis = new DateTimeAxis();
            hAxis.dataUnits = "days";
            // Set this to false to display the leftmost label.
            hAxis.alignLabelsToUnits = false;
            // Take the date in its current format and create a Date
            // object from it.
            hAxis.parseFunction = createDate;
            myChart.horizontalAxis = hAxis;
        }

        public function createDate(s:String):Date {
            // Reformat the date input to create Date objects
            // for the axis.
            var a:Array = s.split("/");

            // The existing String s is in the format "MM/DD/YYYY".
            // To create a Date object, you pass "YYYY,MM,DD",
            // where MM is zero-based, to the Date() constructor.
            var newDate:Date = new Date(a[2],a[0]-1,a[1]);
            return newDate;
        }
    ]]></fx:Script>

    <s:layout>
        <s:VerticalLayout/>
    </s:layout>

  <s:Panel title="Line Chart with Variable Number of Series">
     <s:layout>
         <s:HorizontalLayout/>
     </s:layout>
     <mx:LineChart id="myChart" showDataTips="true"/>
     <mx:Legend dataProvider="{myChart}"/>
  </s:Panel>
</s:Application>
Defining chart data
The chart controls have a dataProvider property that defines the data for the chart.
The data provider creates a level of abstraction between Flex components and the data that you use to populate them. You can populate multiple charts from the same data provider, switch data providers for a chart at run time, and modify the data provider so that changes are reflected by all charts using the data provider.
You can set the data provider on the chart, in which case all series inherit that data provider. Or you can set the data provider on each series in the chart.
Using chart data
To use the data from a data provider in your chart control, you map the xField and yField properties of the chart series to the fields in the data provider. The xField property defines the data for the horizontal axis, and the yField property defines the data for the vertical axis.
In ActionScript object syntax, assume your data provider has the following structure:
{month: "Feb", profit: 1000, expenses: 200, amount: 60}
<data>
	<result month="Feb">
		<profit>1000</profit>
		<expenses>200</expenses>
		<amount>60</amount>
	</result>
</data>
You can use the profit and expenses fields and ignore the month field by mapping the xField property of the series object to one field and the yField property of the series object to another field, as the following example shows:
<mx:PlotSeries xField="profit" yField="expenses"/>
The result is that each data point is the intersection of the profit and expenses fields from the data provider.
To place the data points into a meaningful grouping, you can choose a separate property of the data provider as the categoryField. In this case, to sort each data point by month, you map the month field to the categoryField property of the horizontal axis:
 <mx:horizontalAxis>
 	<mx:CategoryAxis
		dataProvider="{srv.lastResult.data.result}"
		categoryField="month"
	/>
 </mx:horizontalAxis>
In some cases, depending on the type of chart and the type of data you are representing, you use either the xField property or the yField property to define the data series. In a ColumnChart control, for example, the yField property defines the height of the column. You do not have to specify an xField property. To get an axis label for each column, you specify a categoryField property for the horizontalAxis.
The data provider can contain complex objects, or objects within objects. For example, a data provider object can have the following structure:
{month: "Aug", close: {High:45.87,Low:12.2}, open:25.19}
In this case, you cannot simply refer to the field of the data provider by using a categoryField, xField, or similar flat naming convention. Rather, you use the dataFunction of the series or axis to drill down into the data provider. For more information on working with complex data, see Structure of chart data.
When you use chart data, keep the following in mind:
-
You usually match a series with a data provider field if you want to display that series. However, this is not always true. If you do not specify an xField for a ColumnSeries, Flex assumes the index is the value. If you do not specify a yField, Flex assumes the data provider is a collection of y values, rather than a collection of objects that have y values. For example, the following series renders correctly for a ColumnChart control:
<mx:ColumnSeries dataProvider="{[1,2,3,4,5]}"/> -
Some series use only one field from the data provider, while others can use two or more. For example, you specify only a field property for a PieSeries object, but you can specify an xField and a yField for a PlotSeries object and an xField, yField, and radiusField for a BubbleSeries object.
-
Most of the series can determine suitable defaults for their nonprimary dimensions if no field is specified. For example, if you do not explicitly set an xField for the ColumnSeries, LineSeries, and AreaSeries, Flex maps the data to the chart's categories in the order in which the data appears in the data provider. Similarly, a BarSeries maps the data to the categories if you do not set a yField.
For a complete list of the fields that each data series can use, see the data series's class entry in ActionScript 3.0 Reference for Apache Flex. For more information on data providers, see Data provider controls.
Sources of chart data
You can supply data to a data provider in the following ways:
-
Define it in a <fx:Script> block.
-
Define it in an external XML, ActionScript, or text file.
-
Return it by using a WebService call.
-
Return it by using a RemoteObject component.
-
Return it by using an HTTPService component.
-
Define it in MXML.
There are some limitations on the structure of the chart data, and how to reference chart data if it is constructed with complex objects. For more information, see Structure of chart data.
For more information on data providers, see Data providers and collections.
Using static Arrays as data providers
Using a static Array of objects for the data provider is the simplest approach. You typically create an Array of objects, as the following example shows:
<?xml version="1.0"?>
<!-- charts/ArrayOfObjectsDataProvider.mxml -->
<s:Application
    xmlns:fx="http://ns.adobe.com/mxml/2009"
    xmlns:mx="library://ns.adobe.com/flex/mx"
    xmlns:s="library://ns.adobe.com/flex/spark"
    height="600">

  <fx:Script><![CDATA[
     [Bindable]
     private var expenses:Array = [
        {Month:"January",Profit:2000,Expenses:1500,Amount:450},
        {Month:"February",Profit:1000,Expenses:200,Amount:600},
        {Month:"March",Profit:1500,Expenses:500,Amount:300},
        {Month:"April",Profit:500,Expenses:300,Amount:500},
        {Month:"May",Profit:1000,Expenses:450,Amount:250},
        {Month:"June",Profit:2000,Expenses:500,Amount:700}
     ];

  ]]></fx:Script>

    <s:layout>
        <s:VerticalLayout/>
    </s:layout>

  <s:Panel title="Column Chart">
        <s:layout>
            <s:VerticalLayout/>
        </s:layout>
     <mx:ColumnChart id="myChart"
        dataProvider="{expenses}"
        showDataTips="true">
        <mx:horizontalAxis>
           <mx:CategoryAxis
                dataProvider="{expenses}"
                categoryField="Month"/>
        </mx:horizontalAxis>
        <mx:series>
           <mx:ColumnSeries
                xField="Month"
                yField="Profit"
                displayName="Profit"/>
           <mx:ColumnSeries
                xField="Month"
                yField="Expenses"
                displayName="Expenses"/>
        </mx:series>
     </mx:ColumnChart>
     <mx:Legend dataProvider="{myChart}"/>
  </s:Panel>
</s:Application>
You can also use MXML to define the content of an Array, as the following example shows:
<?xml version="1.0"?>
<!-- charts/ArrayOfMXMLObjectsDataProvider.mxml -->
<s:Application
    xmlns:fx="http://ns.adobe.com/mxml/2009"
    xmlns:mx="library://ns.adobe.com/flex/mx"
    xmlns:s="library://ns.adobe.com/flex/spark"
    height="600">

  <fx:Declarations>
      <fx:Array id="expenses">
         <fx:Object
            Month="January"
            Profit="2000"
            Expenses="1500"
            Amount="450"
         />
         <fx:Object
            Month="February"
            Profit="1000"
            Expenses="200"
            Amount="600"
         />
         <fx:Object
            Month="March"
            Profit="1500"
            Expenses="500"
            Amount="300"
         />
         <fx:Object
            Month="April"
            Profit="500"
            Expenses="300"
            Amount="500"
         />
         <fx:Object
            Month="May"
            Profit="1000"
            Expenses="450"
            Amount="250"
         />
         <fx:Object
            Month="June"
            Profit="2000"
            Expenses="500"
            Amount="700"
         />
      </fx:Array>
  </fx:Declarations>

    <s:layout>
        <s:VerticalLayout/>
    </s:layout>

  <s:Panel title="Column Chart">
        <s:layout>
            <s:VerticalLayout/>
        </s:layout>
     <mx:ColumnChart id="myChart"
        dataProvider="{expenses}"
        showDataTips="true">
        <mx:horizontalAxis>
           <mx:CategoryAxis
                dataProvider="{expenses}"
                categoryField="Month"/>
        </mx:horizontalAxis>
        <mx:series>
           <mx:ColumnSeries
                xField="Month"
                yField="Profit"
                displayName="Profit"/>
           <mx:ColumnSeries
                xField="Month"
                yField="Expenses"
                displayName="Expenses"/>
        </mx:series>
     </mx:ColumnChart>
     <mx:Legend dataProvider="{myChart}"/>
  </s:Panel>
</s:Application>
When defining data in an Array in MXML, be sure to wrap it in a <fx:Declarations> tag.
You can also define objects in MXML with a more verbose syntax, as the following example shows:
<?xml version="1.0"?>
<!-- charts/ArrayOfVerboseMXMLObjects.mxml -->
<s:Application
    xmlns:fx="http://ns.adobe.com/mxml/2009"
    xmlns:mx="library://ns.adobe.com/flex/mx"
    xmlns:s="library://ns.adobe.com/flex/spark"
    height="600">

  <fx:Declarations>
      <fx:Array id="expenses">
         <fx:Object>
           <fx:Month>January</fx:Month>
           <fx:Profit>2000</fx:Profit>
           <fx:Expenses>1500</fx:Expenses>
           <fx:Amount>450</fx:Amount>
         </fx:Object>
         <fx:Object>
           <fx:Month>February</fx:Month>
           <fx:Profit>1000</fx:Profit>
           <fx:Expenses>200</fx:Expenses>
           <fx:Amount>600</fx:Amount>
         </fx:Object>
         <fx:Object>
           <fx:Month>March</fx:Month>
           <fx:Profit>1500</fx:Profit>
           <fx:Expenses>500</fx:Expenses>
           <fx:Amount>300</fx:Amount>
         </fx:Object>
         <fx:Object>
           <fx:Month>April</fx:Month>
           <fx:Profit>500</fx:Profit>
           <fx:Expenses>300</fx:Expenses>
           <fx:Amount>300</fx:Amount>
         </fx:Object>
         <fx:Object>
           <fx:Month>May</fx:Month>
           <fx:Profit>1000</fx:Profit>
           <fx:Expenses>450</fx:Expenses>
           <fx:Amount>250</fx:Amount>
         </fx:Object>
         <fx:Object>
           <fx:Month>June</fx:Month>
           <fx:Profit>2000</fx:Profit>
           <fx:Expenses>500</fx:Expenses>
           <fx:Amount>700</fx:Amount>
         </fx:Object>
      </fx:Array>
  </fx:Declarations>

    <s:layout>
        <s:VerticalLayout/>
    </s:layout>

  <s:Panel title="Column Chart">
        <s:layout>
            <s:VerticalLayout/>
        </s:layout>
     <mx:ColumnChart id="myChart" dataProvider="{expenses}" showDataTips="true">
        <mx:horizontalAxis>
           <mx:CategoryAxis
                dataProvider="{expenses}"
                categoryField="Month"/>
        </mx:horizontalAxis>
        <mx:series>
           <mx:ColumnSeries
                xField="Month"
                yField="Profit"
                displayName="Profit"/>
           <mx:ColumnSeries
                xField="Month"
                yField="Expenses"
                displayName="Expenses"/>
        </mx:series>
     </mx:ColumnChart>
     <mx:Legend dataProvider="{myChart}"/>
  </s:Panel>
</s:Application>
A disadvantage of using a simple Array as a chart's data provider is that you can use only the methods of the Array class to manipulate the data. In addition, when you use an Array as a data provider, the data in it must be static. Even if you make the Array bindable, when data in an Array changes, the chart does not reflect those changes. For more robust data manipulation and data binding, you can use a collection for the chart data provider, as described in Using collections as data providers.
Using collections as data providers
Collections are a more robust data provider mechanism than Arrays. They provide operations that include the insertion and deletion of objects as well as sorting and filtering. Collections also support change notification. An ArrayCollection object provides an easy way to expose an Array as an ICollectionView or IList interface.
As with Arrays, you can use MXML to define the contents of a collection, as the following example shows:
<?xml version="1.0"?>
<!-- charts/ArrayCollectionOfMXMLObjectsDataProvider.mxml -->
<s:Application
    xmlns:fx="http://ns.adobe.com/mxml/2009"
    xmlns:mx="library://ns.adobe.com/flex/mx"
    xmlns:s="library://ns.adobe.com/flex/spark"
    height="600">

    <fx:Declarations>
        <s:ArrayCollection id="expenses">
             <fx:Object
                Month="January"
                Profit="2000"
                Expenses="1500"
                Amount="450"/>
             <fx:Object
                Month="February"
                Profit="1000"
                Expenses="200"
                Amount="600"/>
             <fx:Object
                Month="March"
                Profit="1500"
                Expenses="500"
                Amount="300"/>
             <fx:Object
                Month="April"
                Profit="500"
                Expenses="300"
                Amount="500"/>
             <fx:Object
                Month="May"
                Profit="1000"
                Expenses="450"
                Amount="250"/>
             <fx:Object
                Month="June"
                Profit="2000"
                Expenses="500"
                Amount="700"/>
          </s:ArrayCollection>
    </fx:Declarations>

    <s:layout>
        <s:VerticalLayout/>
    </s:layout>

  <s:Panel title="Column Chart">
        <s:layout>
            <s:VerticalLayout/>
        </s:layout>
     <mx:ColumnChart id="myChart"
        dataProvider="{expenses}"
        showDataTips="true">
        <mx:horizontalAxis>
           <mx:CategoryAxis
                dataProvider="{expenses}"
                categoryField="Month"/>
        </mx:horizontalAxis>
        <mx:series>
           <mx:ColumnSeries
                xField="Month"
                yField="Profit"
                displayName="Profit"/>
           <mx:ColumnSeries
                xField="Month"
                yField="Expenses"
                displayName="Expenses"/>
        </mx:series>
     </mx:ColumnChart>
     <mx:Legend dataProvider="{myChart}"/>
  </s:Panel>
</s:Application>
Or you can define an object in MXML using child tags rather than attributes:
<?xml version="1.0"?>
<!-- charts/ArrayCollectionOfVerboseMXMLObjects.mxml -->
<s:Application
    xmlns:fx="http://ns.adobe.com/mxml/2009"
    xmlns:mx="library://ns.adobe.com/flex/mx"
    xmlns:s="library://ns.adobe.com/flex/spark"
    height="600">

    <fx:Declarations>
      <s:ArrayCollection id="expenses">
         <fx:Object>
           <fx:Month>January</fx:Month>
           <fx:Profit>2000</fx:Profit>
           <fx:Expenses>1500</fx:Expenses>
           <fx:Amount>450</fx:Amount>
         </fx:Object>
         <fx:Object>
           <fx:Month>February</fx:Month>
           <fx:Profit>1000</fx:Profit>
           <fx:Expenses>200</fx:Expenses>
           <fx:Amount>600</fx:Amount>
         </fx:Object>
         <fx:Object>
           <fx:Month>March</fx:Month>
           <fx:Profit>1500</fx:Profit>
           <fx:Expenses>500</fx:Expenses>
           <fx:Amount>300</fx:Amount>
         </fx:Object>
         <fx:Object>
           <fx:Month>April</fx:Month>
           <fx:Profit>500</fx:Profit>
           <fx:Expenses>300</fx:Expenses>
           <fx:Amount>300</fx:Amount>
         </fx:Object>
         <fx:Object>
           <fx:Month>May</fx:Month>
           <fx:Profit>1000</fx:Profit>
           <fx:Expenses>450</fx:Expenses>
           <fx:Amount>250</fx:Amount>
         </fx:Object>
         <fx:Object>
           <fx:Month>June</fx:Month>
           <fx:Profit>2000</fx:Profit>
           <fx:Expenses>500</fx:Expenses>
           <fx:Amount>700</fx:Amount>
         </fx:Object>
      </s:ArrayCollection>
    </fx:Declarations>

    <s:layout>
        <s:VerticalLayout/>
    </s:layout>

  <s:Panel title="Column Chart">
        <s:layout>
            <s:VerticalLayout/>
        </s:layout>
     <mx:ColumnChart id="myChart"
        dataProvider="{expenses}"
        showDataTips="true">
        <mx:horizontalAxis>
           <mx:CategoryAxis
                dataProvider="{expenses}"
                categoryField="Month"/>
        </mx:horizontalAxis>
        <mx:series>
           <mx:ColumnSeries
                xField="Month"
                yField="Profit"
                displayName="Profit"/>
           <mx:ColumnSeries
                xField="Month"
                yField="Expenses"
                displayName="Expenses"/>
        </mx:series>
     </mx:ColumnChart>
     <mx:Legend dataProvider="{myChart}"/>
  </s:Panel>
</s:Application>
You can create an ArrayCollection object in ActionScript. If you define an ArrayCollection in this way, ensure that you import the mx.collections.ArrayCollection class, as the following example shows:
<?xml version="1.0"?>
<!-- charts/ArrayCollectionOfObjects.mxml -->
<s:Application
    xmlns:fx="http://ns.adobe.com/mxml/2009"
    xmlns:mx="library://ns.adobe.com/flex/mx"
    xmlns:s="library://ns.adobe.com/flex/spark"
    height="600">

    <s:layout>
        <s:VerticalLayout/>
    </s:layout>

  <fx:Script><![CDATA[
     import mx.collections.ArrayCollection;
     [Bindable]
     private var expenses:ArrayCollection = new ArrayCollection([
        {Month:"January", Profit:2000, Expenses:1500, Amount:450},
        {Month:"February", Profit:1000, Expenses:200, Amount:600},
        {Month:"March", Profit:1500, Expenses:500, Amount:300},
        {Month:"April", Profit:500, Expenses:300, Amount:500},
        {Month:"May", Profit:1000, Expenses:450, Amount:250},
        {Month:"June", Profit:2000, Expenses:500, Amount:700}
     ]);
  ]]></fx:Script>

  <s:Panel title="Column Chart">
        <s:layout>
            <s:VerticalLayout/>
        </s:layout>
     <mx:ColumnChart id="myChart"
        dataProvider="{expenses}"
        showDataTips="true">
        <mx:horizontalAxis>
           <mx:CategoryAxis
                dataProvider="{expenses}"
                categoryField="Month"/>
        </mx:horizontalAxis>
        <mx:series>
           <mx:ColumnSeries
                xField="Month"
                yField="Profit"
                displayName="Profit"/>
           <mx:ColumnSeries
                xField="Month"
                yField="Expenses"
                displayName="Expenses"/>
        </mx:series>
     </mx:ColumnChart>
     <mx:Legend dataProvider="{myChart}"/>
  </s:Panel>
</s:Application>
If your data is in an Array, you can pass the Array to the ArrayCollection's constructor to convert it to an ArrayCollection. The following example creates an Array, and then converts it to an ArrayCollection:
<?xml version="1.0"?>
<!-- charts/ArrayConvertedToArrayCollection.mxml -->
<s:Application
    xmlns:fx="http://ns.adobe.com/mxml/2009"
    xmlns:mx="library://ns.adobe.com/flex/mx"
    xmlns:s="library://ns.adobe.com/flex/spark"
    height="600">

  <fx:Script><![CDATA[
     import mx.collections.ArrayCollection;

     private var expenses:Array = [
        {Month:"January", Profit:2000, Expenses:1500, Amount:450},
        {Month:"February", Profit:1000, Expenses:200, Amount:600},
        {Month:"March", Profit:1500, Expenses:500, Amount:300},
        {Month:"April", Profit:500, Expenses:300, Amount:500},
        {Month:"May", Profit:1000, Expenses:450, Amount:250},
        {Month:"June", Profit:2000, Expenses:500, Amount:700}
     ];

     [Bindable]
     public var expensesAC:ArrayCollection =
        new ArrayCollection(expenses);
  ]]></fx:Script>

    <s:layout>
        <s:VerticalLayout/>
    </s:layout>

  <s:Panel title="Column Chart">
        <s:layout>
            <s:VerticalLayout/>
        </s:layout>
     <mx:ColumnChart id="myChart"
        dataProvider="{expensesAC}"
        showDataTips="true">
        <mx:horizontalAxis>
           <mx:CategoryAxis
                dataProvider="{expensesAC}"
                categoryField="Month"/>
        </mx:horizontalAxis>
        <mx:series>
           <mx:ColumnSeries
                xField="Month"
                yField="Profit"
                displayName="Profit"/>
           <mx:ColumnSeries
                xField="Month"
                yField="Expenses"
                displayName="Expenses"/>
        </mx:series>
     </mx:ColumnChart>
     <mx:Legend dataProvider="{myChart}"/>
  </s:Panel>
</s:Application>
Similarly, you can use an <s:ArrayCollection> tag to perform the conversion:
<?xml version="1.0"?>
<!-- charts/ArrayConvertedToArrayCollectionMXML.mxml -->
<s:Application
    xmlns:fx="http://ns.adobe.com/mxml/2009"
    xmlns:mx="library://ns.adobe.com/flex/mx"
    xmlns:s="library://ns.adobe.com/flex/spark"
    height="600">

  <fx:Script><![CDATA[
     import mx.collections.ArrayCollection;

     [Bindable]
     private var expenses:Array = [
        {Month:"January", Profit:2000, Expenses:1500, Amount:450},
        {Month:"February", Profit:1000, Expenses:200, Amount:600},
        {Month:"March", Profit:1500, Expenses:500, Amount:300},
        {Month:"April", Profit:500, Expenses:300, Amount:500},
        {Month:"May", Profit:1000, Expenses:450, Amount:250},
        {Month:"June", Profit:2000, Expenses:500, Amount:700}
     ];
  ]]></fx:Script>

  <fx:Declarations>
      <s:ArrayCollection id="expensesAC" source="{expenses}"/>
  </fx:Declarations>

    <s:layout>
        <s:VerticalLayout/>
    </s:layout>

  <s:Panel title="Column Chart">
        <s:layout>
            <s:VerticalLayout/>
        </s:layout>
     <mx:ColumnChart id="myChart"
        dataProvider="{expensesAC}"
        showDataTips="true">
        <mx:horizontalAxis>
           <mx:CategoryAxis
                dataProvider="{expensesAC}"
                categoryField="Month"/>
        </mx:horizontalAxis>
        <mx:series>
           <mx:ColumnSeries
                xField="Month"
                yField="Profit"
                displayName="Profit"/>
           <mx:ColumnSeries
                xField="Month"
                yField="Expenses"
                displayName="Expenses"/>
        </mx:series>
     </mx:ColumnChart>
     <mx:Legend dataProvider="{myChart}"/>
  </s:Panel>
</s:Application>
The data in ArrayCollections can be bound to the chart's data provider so that the data can be updated in real-time. The following example creates an object with elapsed time and total memory usage every second. It then pushes that new object onto an ArrayCollection that is used as the data provider for a line chart. As a result, the chart itself updates every second showing memory usage of Adobe® Flash® Player or Adobe® AIR™ over time.
<?xml version="1.0"?>
<!-- charts/RealTimeArrayCollection.mxml -->
<s:Application
    xmlns:fx="http://ns.adobe.com/mxml/2009"
    xmlns:mx="library://ns.adobe.com/flex/mx"
    xmlns:s="library://ns.adobe.com/flex/spark"
    initialize="initTimer()"
    height="600">

  <fx:Script><![CDATA[
      import flash.utils.Timer;
      import flash.events.TimerEvent;
      import mx.collections.ArrayCollection;

      [Bindable]
      public var memoryUsage:ArrayCollection = new ArrayCollection();

      public function initTimer():void {
         // The first parameter in the Timer constructor
         // is the interval, in milliseconds.
         // The second parameter is how many times to run (0 is
         // infinity).
         var myTimer:Timer = new Timer(1000, 0);

         // Add the listener for the timer event.
         myTimer.addEventListener("timer", timerHandler);
         myTimer.start();
      }

      public function timerHandler(event:TimerEvent):void {
         var o:Object = new Object();

         // Get the number of milliseconds since Flash Player or AIR started.
         o.time = getTimer();

         // Get the total memory Flash Player or AIR is using.
         o.memory = flash.system.System.totalMemory;
         trace(o.time + ":" + o.memory);

         // Add new object to the ArrayCollection, which is bound
         // to the chart's data provider.
         memoryUsage.addItem(o);
      }
  ]]></fx:Script>

    <s:layout>
        <s:VerticalLayout/>
    </s:layout>

  <s:Panel title="Memory Usage">
     <s:layout>
         <s:VerticalLayout/>
     </s:layout>
      <mx:LineChart id="chart"
        dataProvider="{memoryUsage}"
         showDataTips="true">
         <mx:horizontalAxis>
            <mx:LinearAxis/>
         </mx:horizontalAxis>
         <mx:verticalAxis>
            <mx:LinearAxis minimum="5000000"/>
         </mx:verticalAxis>
         <mx:series>
            <mx:LineSeries yField="memory"/>
         </mx:series>
      </mx:LineChart>
    </s:Panel>
</s:Application>
Data collections can be paged, which means that data is sent to the client in chunks as the application requests it. But Flex charting controls display all of the data all of the time, by default. As a result, when you use data collections with charts, you should disable the paging features or use non-paged views of the data collection for chart data.
For more information on using collections, see Data providers and collections.
Using an XML file as a data provider
You can define data provider data in a structured file. The following example shows the contents of the data.xml file:
<data>

<result month="Jan-04">


<apple>81768</apple>


<orange>60310</orange>


<banana>43357</banana>

</result>

<result month="Feb-04">


<apple>81156</apple>


<orange>58883</orange>


<banana>49280</banana>

</result>
</data>
You can load the file directly as a source of a Model, as the following example shows:
<?xml version="1.0"?>
<!-- charts/XMLFileDataProvider.mxml -->
<s:Application
    xmlns:fx="http://ns.adobe.com/mxml/2009"
    xmlns:mx="library://ns.adobe.com/flex/mx"
    xmlns:s="library://ns.adobe.com/flex/spark"
    height="600">

    <fx:Declarations>
        <fx:Model id="results" source="../assets/data.xml"/>
    </fx:Declarations>

    <s:layout>
        <s:VerticalLayout/>
    </s:layout>

  <s:Panel title="Line Chart">
     <s:layout>
         <s:HorizontalLayout/>
     </s:layout>
     <mx:LineChart id="myChart"
        dataProvider="{results.result}" showDataTips="true">
        <mx:horizontalAxis>
           <mx:CategoryAxis categoryField="month"/>
        </mx:horizontalAxis>
        <mx:series>
           <mx:LineSeries yField="banana" displayName="Banana"/>
           <mx:LineSeries yField="apple" displayName="Apple"/>
           <mx:LineSeries yField="orange" displayName="Orange"/>
        </mx:series>
     </mx:LineChart>
     <mx:Legend dataProvider="{myChart}"/>
  </s:Panel>
</s:Application>
You can use more complex XML to define the data provider's data. For example, an XML-based data provider can have nested tags. In that case, however, you must use a dataFunction to define the fields that the chart uses. For more information, see Structure of chart data.
To use an ArrayCollection as the chart's data provider, you convert the Model to an ArrayCollection, as the following example shows:
<?xml version="1.0"?>
<!-- charts/XMLFileToArrayCollectionDataProvider.mxml -->
<s:Application
    xmlns:fx="http://ns.adobe.com/mxml/2009"
    xmlns:mx="library://ns.adobe.com/flex/mx"
    xmlns:s="library://ns.adobe.com/flex/spark"

height="600">

    <fx:Declarations>
        <fx:Model id="results" source="../assets/data.xml"/>
        <s:ArrayCollection id="myAC"
            source="{ArrayUtil.toArray(results.result)}"/>
    </fx:Declarations>

    <fx:Script>
        import mx.utils.ArrayUtil;
    </fx:Script>

    <s:layout>
        <s:VerticalLayout/>
    </s:layout>

  <s:Panel title="Line Chart">
     <s:layout>
         <s:HorizontalLayout/>
     </s:layout>
     <mx:LineChart id="myChart"
        dataProvider="{myAC}" showDataTips="true">
        <mx:horizontalAxis>
           <mx:CategoryAxis categoryField="month"/>
        </mx:horizontalAxis>
        <mx:series>
           <mx:LineSeries yField="banana" displayName="Banana"/>
           <mx:LineSeries yField="apple" displayName="Apple"/>
           <mx:LineSeries yField="orange" displayName="Orange"/>
        </mx:series>
     </mx:LineChart>
     <mx:Legend dataProvider="{myChart}"/>
  </s:Panel>
</s:Application>
Using HTTPService as a data provider
You can define an XML file or any page that returns an XML result as a URL for an HTTPService component. You then bind the HTTPService result directly to the chart's data provider, as the following example shows:
<?xml version="1.0"?>
<!-- charts/HTTPServiceDataProvider.mxml -->
<s:Application
    xmlns:fx="http://ns.adobe.com/mxml/2009"
    xmlns:mx="library://ns.adobe.com/flex/mx"
    xmlns:s="library://ns.adobe.com/flex/spark"
    creationComplete="srv.send()"
    height="600">

    <fx:Declarations>
        <!-- View source of the following page to see the structure of the data that Flex uses in this example. -->
        <mx:HTTPService id="srv" url="http://examplesserver/chart_examples/expenses-xml.aspx"/>
        <!-- To see data in an HTML table, go to http://examplesserver/chart_examples/expenses.aspx -->
    </fx:Declarations>

    <s:layout>
        <s:VerticalLayout/>
    </s:layout>

  <s:Panel title="Line Chart">
        <s:layout>
            <s:VerticalLayout/>
        </s:layout>
     <mx:LineChart id="myChart"
        dataProvider="{srv.lastResult.data.result}"
        showDataTips="true">
        <mx:horizontalAxis>
           <mx:CategoryAxis categoryField="month"/>
        </mx:horizontalAxis>
        <mx:series>
          <mx:LineSeries
                yField="profit"
                displayName="Profit"/>
           <mx:LineSeries
                yField="expenses"
                displayName="Expenses"/>
         </mx:series>
     </mx:LineChart>
     <mx:Legend dataProvider="{myChart}"/>
  </s:Panel>
</s:Application>
As with most other non-visual components, be sure to wrap the <mx:HTTPService> tag in a <fx:Declarations> tag.
<data>
	<result month="Jan">
		<profit>2000</profit>
		<expenses>1500</expenses>
		<amount>450</amount>
	</result>
	<result month="Feb">
		<profit>1000</profit>
		<expenses>200</expenses>
		<amount>600</amount>
	</result>
	<result month="Mar">
		<profit>1500</profit>
		<expenses>500</expenses>
		<amount>300</amount>
	</result>
</data>
To use an ArrayCollection, you cast the HTTPService result, as the following example shows:
<?xml version="1.0"?>
<!-- charts/HTTPServiceToArrayCollectionDataProvider.mxml -->
<s:Application
    xmlns:fx="http://ns.adobe.com/mxml/2009"
    xmlns:mx="library://ns.adobe.com/flex/mx"
    xmlns:s="library://ns.adobe.com/flex/spark"
    creationComplete="srv.send()"
    height="600">

    <fx:Declarations>
        <!-- View source of the following page to see the structure of the data that Flex uses in this example. -->
        <!-- To see data in an HTML table, go to http://examplesserver/chart_examples/expenses.aspx -->
        <mx:HTTPService id="srv"
            url="http://examplesserver/chart_examples/expenses-xml.aspx"
            useProxy="false"
            result="myData=ArrayCollection(srv.lastResult.data.result)"
        />
    </fx:Declarations>

  <fx:Script><![CDATA[
     import mx.collections.ArrayCollection;
     [Bindable]
     public var myData:ArrayCollection;
  ]]></fx:Script>

    <s:layout>
        <s:VerticalLayout/>
    </s:layout>

  <s:Panel title="Line Chart">
        <s:layout>
            <s:VerticalLayout/>
        </s:layout>
     <mx:LineChart id="myChart"
        dataProvider="{myData}" showDataTips="true">
        <mx:horizontalAxis>
           <mx:CategoryAxis categoryField="month"/>
        </mx:horizontalAxis>
        <mx:series>
          <mx:LineSeries
                yField="profit"
                displayName="Profit"/>
           <mx:LineSeries
                yField="expenses"
                displayName="Expenses"/>
        </mx:series>
     </mx:LineChart>
     <mx:Legend dataProvider="{myChart}"/>
  </s:Panel>
</s:Application>
You can also set the result format of the HTTPService to E4X, and then use it as a source for an XMLListCollection object, as the following example shows:
<?xml version="1.0"?>
<!-- charts/HTTPServiceToXMLListCollection.mxml -->
<s:Application
    xmlns:fx="http://ns.adobe.com/mxml/2009"
    xmlns:mx="library://ns.adobe.com/flex/mx"
    xmlns:s="library://ns.adobe.com/flex/spark"
    creationComplete="srv.send()"
    height="600">

    <fx:Declarations>
        <!-- View source of the following page to see the structure of the data that Flex uses in this example. -->
        <!-- To see data in an HTML table, go to http://examplesserver/chart_examples/expenses.aspx -->
        <mx:HTTPService id="srv"
            url="http://examplesserver/chart_examples/expenses-xml.aspx"
            resultFormat="e4x"
        />

        <mx:XMLListCollection id="myAC"
            source="{srv.lastResult.result}"
        />

    </fx:Declarations>
  <fx:Script><![CDATA[

     import mx.utils.ArrayUtil;

  ]]></fx:Script>

    <s:layout>
        <s:VerticalLayout/>
    </s:layout>

  <s:Panel title="Line Chart">
        <s:layout>
            <s:VerticalLayout/>
        </s:layout>
     <mx:LineChart id="myChart"
        dataProvider="{myAC}" showDataTips="true">
        <mx:horizontalAxis>
           <mx:CategoryAxis categoryField="@month"/>
        </mx:horizontalAxis>
        <mx:series>
          <mx:LineSeries
                yField="profit"
                displayName="Profit"/>
           <mx:LineSeries
                yField="expenses"
                displayName="Expenses"/>
        </mx:series>
     </mx:LineChart>
     <mx:Legend dataProvider="{myChart}"/>
  </s:Panel>
</s:Application>
Another approach is to define the target URL of the HTTPService component as an HTML page that contains data. For example, you might have an HTML page with source that looks like the following:
 <html>
 <body>
 <h1>This is a data page</h1>
 <!-- data starts here -->
 <entry>
 	<month>Jan</month>
 	<misc>15300</misc>
 </entry>
 <entry>
 	<month>Feb</month>
 	<misc>17800</misc>
 </entry>
 <entry>
 	<month>Mar</month>
 	<misc>20000</misc>
 </entry>
 <!-- data ends here -->
 </body>
 </html>
In your application, you can extract the data from the HTML page by using regular expressions. You can then assign the resulting string to an XMLList and use it as a data provider, as the following example shows:
<?xml version="1.0"?>
<!-- charts/HTMLDataProvider.mxml -->
<s:Application
    xmlns:fx="http://ns.adobe.com/mxml/2009"
    xmlns:mx="library://ns.adobe.com/flex/mx"
    xmlns:s="library://ns.adobe.com/flex/spark"
    creationComplete="initApp()"
    height="600">

    <fx:Declarations>
        <mx:HTTPService id="serviceInput"
            resultFormat="text"
            url="http://examplesserver/chart_examples/testDataPage.html"
        />
    </fx:Declarations>

    <fx:Script><![CDATA[
        import mx.events.FlexEvent;
        import mx.rpc.events.ResultEvent;
        import mx.rpc.events.FaultEvent;

        [Bindable]
        public var chartData:XMLList;
        private function initApp():void {
            serviceInput.addEventListener(ResultEvent.RESULT, resultHandler);
            serviceInput.addEventListener(FaultEvent.FAULT, faultHandler);
            serviceInput.send();
        }

        public function resultHandler(evt:Event):void {
            // Extract the XML data from the HTML page.
            var htmlBlob:String = serviceInput.lastResult.toString();

            htmlBlob = htmlBlob.slice( htmlBlob.indexOf("<!-- data starts here -->", 0) +
                25, htmlBlob.length );
            htmlBlob = htmlBlob.slice( 0, htmlBlob.indexOf("<!-- data ends here -->", 0) );
            // Create an XMLList from the extracted XML data.
            chartData = new XMLList(htmlBlob);
        }

        public function faultHandler(evt:Event):void {
            trace(evt.toString());
        }
    ]]></fx:Script>

    <s:layout>
        <s:VerticalLayout/>
    </s:layout>

  <s:Panel title="Line chart with data extracted from HTML page">
        <s:layout>
            <s:VerticalLayout/>
        </s:layout>
         <mx:LineChart id="chart"
            dataProvider="{chartData}" showDataTips="true">
             <mx:series>
                 <mx:LineSeries id="series1" yField="misc" xField="month"/>
             </mx:series>
             <mx:horizontalAxis>
                 <mx:CategoryAxis categoryField="month"/>
             </mx:horizontalAxis>
         </mx:LineChart>
     </s:Panel>
</s:Application>
To load the data from a URL on another domain, that target domain must have a crossdomain.xml policy file in place. That policy file must allow the domain on which your Flex application is running to access its data.
In this example, if you requested the data page, the data does not render in the brower because it is wrapped in tags that are outside of the HTML specification. If the data were meant to be displayed, it might be surrounded in HTML entities for the left and right angle brackets, like the following example shows:
<html> <body> <h1>This is a data page</h1> <!-- data starts here --> <entry> <month>Jan</month> <misc>15300</misc> </entry> <entry> <month>Feb</month> <misc>17800</misc> </entry> <entry> <month>Mar</month> <misc>20000</misc> </entry> <!-- data ends here --> </body> </html>
In that case, you could replace the HTML entities with angle brackets after the source was loaded, as the following example shows:
var tagPattern:RegExp = /<[^<>]*>/g; htmlBlob = htmlBlob.replace(tagPattern, ""); var ltPattern:RegExp = /</g; htmlBlob = htmlBlob.replace(ltPattern, "<"); var gtPattern:RegExp = />/g; htmlBlob = htmlBlob.replace(gtPattern, ">");
Randomly generating chart data
A useful way to create data for use in sample charts is to generate random data. The following example generates test data for use with the chart controls:
<?xml version="1.0"?>
<!-- charts/RandomDataGeneration.mxml -->
<s:Application
    xmlns:fx="http://ns.adobe.com/mxml/2009"
    xmlns:mx="library://ns.adobe.com/flex/mx"
    xmlns:s="library://ns.adobe.com/flex/spark"
    creationComplete="initApp()"
    height="600">

  <fx:Script><![CDATA[
     import mx.collections.*;

     // Define data provider array for the chart data.
     [Bindable]
     public var dataSet:ArrayCollection;

     // Define the number of elements in the array.
     public var dsLength:Number = 10;

     public function initApp():void {
        // Initialize data provider array.
        dataSet = new ArrayCollection(genData());
     }

     public function genData():Array {
        var result:Array = [];

        for (var i:int=0;i<dsLength;i++) {
           var localVals:Object = {
                valueA:Math.random()*100,
                valueB:Math.random()*100,
                valueX:Math.random()*100,
                valueY:Math.random()*100
           };

           // Push new object onto the data array.
           result.push(localVals);
        }
        return result;
     }
  ]]></fx:Script>

    <s:layout>
        <s:VerticalLayout/>
    </s:layout>

  <s:Panel title="Plot Chart">
     <s:layout>
         <s:VerticalLayout/>
     </s:layout>
     <mx:PlotChart id="myChart"
        dataProvider="{dataSet}" showDataTips="true">
        <mx:series>
           <mx:PlotSeries
                xField="valueX"
                yField="valueY"
                displayName="Series 1"/>
           <mx:PlotSeries
                xField="valueA"
                yField="valueB"
                displayName="Series 2"/>
        </mx:series>
     </mx:PlotChart>
     <mx:Legend id="l1" dataProvider="{myChart}"/>
  </s:Panel>
</s:Application>
Structure of chart data
In most cases, the data that is used as the chart's data provider is made up of scalar values. For example, objects contain a single set of fields:
{month: "Aug", close: 45.87, open:25.19},
Or XML data contains a single set of child tags in a flat structure:
 <stock>
 	<month>Aug</month>
 	<close>45.87</close>
 	<open>25.19</open>
 </stock>
In these cases, you assign the data provider's fields to items in the chart by using the xField and yField for the series, or the categoryField for the axis; for example:
 <mx:ColumnSeries yField="close"/>
 <mx:CategoryAxis categoryField="month"/>
However, the structure of the chart data can be made up of more complex objects, such as objects within objects or XML with nested child tags. For example, you can embed an object within an object:
{month: "Aug", close: {High:45.87,Low:12.2}, open:25.19}
Or use nested tags in an XML object:
 <stock>
 	<date>
 		<month>Aug</month>
 	</date>
 	<price>
 		<close>45.87</close>
 		<open>25.19</open>
 	</price>
 </stock>
In these cases, you cannot refer to the target data by using the flat naming such as yField="close". You also cannot use dot notation. For example, yField="values.close" or categoryField="data.month" are not valid. Instead, you must use a dataFunction method to define which ChartItem fields are populated by the data provider.
For the CategoryAxis class, the dataFunction has the following signature:
function_name(axis:AxisBase, item:Object):Object
Where axis is the base class for the current axis, and item is the item in the data provider.
For the Series class, the dataFunction has the following signature:
function_name(series:Series, item:Object, fieldName:String):Object
Where series is a reference to the current series, item is the item in the data provider, and fieldName is the field in the current ChartItem that will be populated.
The following example creates two functions that access complex data for both the axis and the series:
<?xml version="1.0"?>
<!-- charts/DataFunctionExample.mxml -->
<s:Application
    xmlns:fx="http://ns.adobe.com/mxml/2009"
    xmlns:mx="library://ns.adobe.com/flex/mx"
    xmlns:s="library://ns.adobe.com/flex/spark"
    height="600">

  <fx:Script><![CDATA[
    import mx.charts.chartClasses.AxisBase;
    import mx.charts.chartClasses.Series;
    import mx.charts.CategoryAxis;
    import mx.charts.chartClasses.IAxis;
    import mx.charts.chartClasses.ChartBase;
    import mx.charts.chartClasses.CartesianTransform;

    // This data provider contains complex, nested objects.
    [Bindable]
    public var SMITH:Array = [
        {month: "Aug", close: {High:45.87,Low:12.2}, open:25.19},
        {month: "Sep", close: {High:45.74,Low:10.23}, open:35.29},
        {month: "Oct", close: {High:45.77,Low:12.13}, open:45.19},
        {month: "Nov", close: {High:46.06,Low:10.45}, open:15.59},
    ];

    private function dataFunc(series:Series, item:Object, fieldName:String):Object {
        trace("fieldName: " + fieldName);
        if(fieldName == "yValue" && series.id=="highClose")
            return(item.close.High);
        else if(fieldName == "yValue" && series.id=="lowClose")
            return(item.close.Low);
        else if(fieldName == "xValue")
            return(item.month);
        else
            return null;
      }
    private function catFunc(axis:AxisBase, item:Object):Object {
        for (var s:String in item) {
            trace(s + ":" + item[s]);
        }

        return(item.month);
    }
   ]]></fx:Script>

    <s:layout>
        <s:VerticalLayout/>
    </s:layout>

  <s:Panel title="ColumnChart">
        <s:layout>
            <s:VerticalLayout/>
        </s:layout>
        <mx:ColumnChart id="chart"
            dataProvider="{SMITH}"
            showDataTips="true"
            width="100%"
            height="100%">
            <mx:horizontalAxis>
                <!-- The dataFunction replaces "categoryField='month'. -->
                <mx:CategoryAxis id="h1" dataFunction="catFunc"/>
            </mx:horizontalAxis>
            <mx:series>
                <!-- The dataFunction replaces yField value, which cannot drill
                down into an object (close.High is not valid). -->
                <mx:ColumnSeries id="highClose"
                    displayName="Close (High)"
                    dataFunction="dataFunc"/>

                <!-- The dataFunction replaces yField value, which cannot drill
                down into an object (close.Low is not valid). -->
                <mx:ColumnSeries id="lowClose"
                    displayName="Close (Low)"
                    dataFunction="dataFunc"/>
            </mx:series>
        </mx:ColumnChart>
    </s:Panel>
</s:Application>
Changing chart data at run time
Using ActionScript, you can change a charting control's data at run time by using a variety of methods.
You can change a chart or a series data provider. To do this with an HTTPService as the source of your data provider, you change the URL and then call the HTTPService control's send() method again.
<?xml version="1.0"?>
<!-- charts/ChangeSrvDataProvider.mxml -->
<s:Application
    xmlns:fx="http://ns.adobe.com/mxml/2009"
    xmlns:mx="library://ns.adobe.com/flex/mx"
    xmlns:s="library://ns.adobe.com/flex/spark"
    creationComplete="srv.send()"
    height="600">

    <fx:Declarations>
        <!-- View source of the following page to see the structure of the data that Flex uses in this example. -->
        <mx:HTTPService id="srv" url="http://examplesserver/chart_examples/stocks-xml.aspx"/>
        <!-- To see data in an HTML table, go to http://examplesserver/chart_examples/stocks.aspx -->
    </fx:Declarations>

    <fx:Script><![CDATA[
        public function changeDataProvider(event:Event):void {
            srv.url = "http://examplesserver/chart_examples/stocks-xml.aspx" +
                "?" + "tickerSymbol=" + event.currentTarget.selectedItem;
                srv.send();
        }
    ]]></fx:Script>

    <s:layout>
        <s:VerticalLayout/>
    </s:layout>

    <s:Panel title="Column Chart">
        <s:layout>
            <s:VerticalLayout/>
        </s:layout>
        <mx:ColumnChart id="myChart" dataProvider="{srv.lastResult.data.result}" showDataTips="true">
            <mx:horizontalAxis>
                <mx:DateTimeAxis dataUnits="days"/>
            </mx:horizontalAxis>
            <mx:series>
                <mx:ColumnSeries
                    yField="close" xField="date"
                    displayName="Closing Price of {cb1.selectedItem}"/>
            </mx:series>
        </mx:ColumnChart>
        <mx:Legend dataProvider="{myChart}"/>
    </s:Panel>

    <s:ComboBox id="cb1" change="changeDataProvider(event)">
        <s:ArrayCollection>
            <fx:String>FRED</fx:String>
            <fx:String>STRK</fx:String>
            <fx:String>FE</fx:String>
        </s:ArrayCollection>
    </s:ComboBox>
</s:Application>
The following example defines the data providers as ArrayCollections. It then binds the data provider to a local variable. The example then toggles the chart's data provider using that local variable when the user clicks the button.
<?xml version="1.0"?>
<!-- charts/ChangeDataProvider.mxml -->
<s:Application
    xmlns:fx="http://ns.adobe.com/mxml/2009"
    xmlns:mx="library://ns.adobe.com/flex/mx"
    xmlns:s="library://ns.adobe.com/flex/spark"
    height="600">

    <fx:Script>
        <![CDATA[
        import mx.collections.ArrayCollection;

        [Bindable]
        public var expenses:ArrayCollection = new ArrayCollection([
            {Month:"Jan", Profit:2000, Expenses:1500, Amount:450},
            {Month:"Feb", Profit:1000, Expenses:200, Amount:600},
            {Month:"Mar", Profit:1500, Expenses:500, Amount:300}
        ]);

        [Bindable]
        public var expenses2:ArrayCollection = new ArrayCollection([
            {Month:"Jan", Profit:2400, Expenses:1509, Amount:950},
            {Month:"Feb", Profit:3000, Expenses:2200, Amount:400},
            {Month:"Mar", Profit:3500, Expenses:1200, Amount:200}
        ]);

        [Bindable]
        public var dp:ArrayCollection = expenses;

        public function changeDataProvider():void {
            if (dp==expenses) {
                dp = expenses2;
            } else {
                dp = expenses;
            }
        }
        ]]>
    </fx:Script>

    <s:layout>
        <s:VerticalLayout/>
    </s:layout>

    <s:Panel title="Line Chart">
        <s:layout>
            <s:VerticalLayout/>
        </s:layout>
        <mx:LineChart id="myChart" dataProvider="{dp}" showDataTips="true">
            <mx:horizontalAxis>
                <mx:CategoryAxis
                    dataProvider="{dp}"
                    categoryField="Month"/>
            </mx:horizontalAxis>
            <mx:series>
                <mx:LineSeries
                    yField="Profit"
                    displayName="Profit"/>
                <mx:LineSeries
                    yField="Expenses"
                    displayName="Expenses"/>
                <mx:LineSeries
                    yField="Amount"
                    displayName="Amount"/>
            </mx:series>
        </mx:LineChart>
        <mx:Legend dataProvider="{myChart}"/>
    </s:Panel>

    <s:Button id="b1"
        label="Change Data Provider"
        click="changeDataProvider()"/>
</s:Application>
You can add or remove a data point from a series in ActionScript. The following example adds an item to the existing data provider when the user clicks the button:
<?xml version="1.0"?>
<!-- charts/AddDataItem.mxml -->
<s:Application
    xmlns:fx="http://ns.adobe.com/mxml/2009"
    xmlns:mx="library://ns.adobe.com/flex/mx"
    xmlns:s="library://ns.adobe.com/flex/spark"
    xmlns="*" height="600" width="700">

    <s:layout>
        <s:VerticalLayout/>
    </s:layout>

    <fx:Script><![CDATA[
        import mx.collections.ArrayCollection;
        [Bindable]
        public var dpac:ArrayCollection =  new ArrayCollection([
           {A:2000},
           {A:3000},
           {A:4000},
           {A:4000},
           {A:3000},
           {A:2000},
           {A:6000}
        ]);

        public function addDataItem():void {
            var o:Object = {"A":2000};
            dpac.addItem(o);
        }

        private function removeItem():void {
            var i:int = dpac.length;
            if (i > 0) {
                dpac.removeItemAt(i - 1);
            }
        }
    ]]></fx:Script>

  <s:Panel title="Column Chart">
    <s:layout>
        <s:VerticalLayout/>
    </s:layout>
     <mx:ColumnChart id="myChart"
        showDataTips="true"
        height="400"
        width="600"
        dataProvider="{dpac}">
        <mx:series>
            <mx:ColumnSeries yField="A" displayName="Series 1"/>
        </mx:series>
     </mx:ColumnChart>
     <mx:Legend dataProvider="{myChart}"/>
  </s:Panel>
  <s:HGroup>
      <s:Button label="Add Data Item" click="addDataItem();"/>
      <s:Button label="Remove Data Item" click="removeItem();"/>
  </s:HGroup>
</s:Application>
You can also change the fields of a series to change chart data at run time. You do this by changing the value of the data provider field (such as xField or yField) on the series object. To get a reference to the series, you use the series' id property or the chart control's series index. The following example toggles the data series when the user clicks on the Change Series button:
<?xml version="1.0"?>
<!-- charts/ToggleSeries.mxml -->
<s:Application
    xmlns:fx="http://ns.adobe.com/mxml/2009"
    xmlns:mx="library://ns.adobe.com/flex/mx"
    xmlns:s="library://ns.adobe.com/flex/spark"
    initialize="initApp();"
    height="600">

  <fx:Script><![CDATA[
     [Bindable]
     public var dataSet:Array;
     public var myStates:Array =
        ["Wisconsin","Ohio","Arizona","Penn"];
     public var curSeries:String;
     public function initApp():void {
        var newData:Array = [];
        for(var i:int=0;i<myStates.length;i++) {
           newData[i] = {
             Apples: Math.floor(Math.random()*150),
             Oranges: Math.floor(Math.random()*150),
             myState: myStates[i]
           }
        }
        dataSet = newData;
        curSeries = "apples";
     }
     public function changeData():void {
        var series:Object = myChart.series[0];
        if (curSeries == "apples") {
           curSeries="oranges";
           series.yField = "Oranges";
           series.displayName = "Oranges";
           series.setStyle("fill",0xFF9933);
        } else {
           curSeries="apples";
           series.yField = "Apples";
           series.displayName = "Apples";
           series.setStyle("fill",0xFF0000);
        }
     }
  ]]></fx:Script>

    <s:layout>
        <s:VerticalLayout/>
    </s:layout>

    <s:Panel title="Column Chart">
        <s:layout>
            <s:VerticalLayout/>
        </s:layout>
        <mx:ColumnChart id="myChart"
            dataProvider="{dataSet}" showDataTips="true">
            <mx:horizontalAxis>
                <mx:CategoryAxis dataProvider="{dataSet}"
                    categoryField="myState"/>
            </mx:horizontalAxis>
            <mx:series>
                <mx:ColumnSeries yField="Apples" displayName="Apples">
                    <mx:fill>
                        <mx:SolidColor color="0xFF0000"/>
                    </mx:fill>
                </mx:ColumnSeries>
            </mx:series>
        </mx:ColumnChart>
        <mx:Legend dataProvider="{myChart}"/>
    </s:Panel>

    <s:Button id="b1" label="Toggle Series" click="changeData()"/>

</s:Application>
You can take advantage of data binding to make your chart reflect data changes in real time. The following example uses a Timer to define the intervals at which it checks for new data. Because the chart's data provider is bound to an ArrayCollection, whenever a new data point is added to the collection, the chart is automatically updated.
<?xml version="1.0"?>
<!-- charts/WatchingCollections.mxml -->
<s:Application
    xmlns:fx="http://ns.adobe.com/mxml/2009"
    xmlns:mx="library://ns.adobe.com/flex/mx"
    xmlns:s="library://ns.adobe.com/flex/spark"
    initialize="initData();"
    height="600">

    <fx:Declarations>
        <mx:SeriesInterpolate id="interp"
            elementOffset="0"
            duration="300"
            minimumElementDuration="0"
        />
    </fx:Declarations>

    <fx:Script><![CDATA[
        import mx.collections.ArrayCollection;

        [Bindable]
        public var dataSet:ArrayCollection;

        [Bindable]
        public var revenue:Number = 100;

        private var t:Timer;

        private function initData():void {
            dataSet = new ArrayCollection();
            t = new Timer(500);
        }
        private function startApp():void {
            t.addEventListener(TimerEvent.TIMER, addData);
            t.start();
        }

        private function addData(e:Event):void {
            /* Add a maximum of 100 data points before user has to click
               the Start button again. */
            if (dataSet.length > 100) {
                stopApp();
            }

            dataSet.addItem( { revenue: revenue } );
            revenue += Math.random() * 10 - 5;
        }

        private function stopApp():void {
            t.stop();
            t.removeEventListener(TimerEvent.TIMER, addData);
        }
    ]]></fx:Script>

    <s:layout>
        <s:VerticalLayout/>
    </s:layout>

    <s:Panel title="Line Chart">
         <s:layout>
             <s:HorizontalLayout/>
         </s:layout>
        <mx:LineChart id="myChart" dataProvider="{dataSet}">
            <mx:series>
                <mx:LineSeries
                    yField="revenue"
                    showDataEffect="{interp}"
                    displayName="Revenue"/>
            </mx:series>
            <mx:horizontalAxis>
                <mx:LinearAxis autoAdjust="false"/>
            </mx:horizontalAxis>
        </mx:LineChart>
        <mx:Legend dataProvider="{myChart}"/>
    </s:Panel>

    <s:HGroup>
        <s:Button id="b1" label="Start" click="startApp()"/>
        <s:Button id="b2" label="Stop" click="stopApp()"/>
    </s:HGroup>

</s:Application>
You can also use system values to update charts at run time. The following example tracks the value of the totalMemory property in a LineChart control in real time:
<?xml version="1.0"?>
<!-- charts/MemoryGraph.mxml -->
<s:Application
    xmlns:fx="http://ns.adobe.com/mxml/2009"
    xmlns:mx="library://ns.adobe.com/flex/mx"
    xmlns:s="library://ns.adobe.com/flex/spark"
    initialize="initTimer()"
    height="600">

  <fx:Script><![CDATA[
      import flash.utils.Timer;
      import flash.events.TimerEvent;
      import mx.collections.ArrayCollection;

      [Bindable]
      public var memoryUsage:ArrayCollection = new ArrayCollection();

        public function initTimer():void {
           /* The first parameter in the Timer constructor
              is the interval, in milliseconds. The second
              parameter is how many times to run (0 is
              infinity). */
           var myTimer:Timer = new Timer(1000, 0);

           /* Add the listener for the timer event. */
           myTimer.addEventListener("timer", timerHandler);
           myTimer.start();
        }

        public function timerHandler(event:TimerEvent):void {
           var o:Object = new Object();

           /* Get the number of milliseconds since Flash
              Player started. */
           o.time = getTimer();

           /* Get the total memory Flash Player is using. */
           o.memory = flash.system.System.totalMemory;

           /* Add new object to the ArrayCollection, which
              is bound to the chart's data provider. */
           memoryUsage.addItem(o);
        }
  ]]></fx:Script>

    <s:layout>
        <s:VerticalLayout/>
    </s:layout>

    <s:Panel id="p1" title="Memory Usage">
        <s:layout>
            <s:VerticalLayout/>
        </s:layout>

        <mx:LineChart id="chart"
            dataProvider="{memoryUsage}"
            showDataTips="true">
            <mx:horizontalAxis>
                <mx:LinearAxis/>
            </mx:horizontalAxis>

            <mx:verticalAxis>
                <mx:LinearAxis minimum="5000000"/>
            </mx:verticalAxis>
            <mx:series>
                <fx:Array>
                    <mx:LineSeries yField="memory"/>
                </fx:Array>
            </mx:series>
        </mx:LineChart>
    </s:Panel>
</s:Application>
Using charts in MX-only applications
An MX-only application is an application that does not use any classes from the spark.swc file in its library path. The main application's root tag is the MX Application class, and no components from the Spark component set are used.
You can use the Flex charting controls in MX-only applications. However, some charting components such as the BarChart and ColumnChart controls, use Spark components by default. As a result, to use charts in MX-only applications, you must apply the MXCharts.css theme to your application. This convenience theme file replaces the use of the Spark Label classes with the MX Label class for the labelClass style property.
mxmlc -theme+=../frameworks/projects/charts/MXCharts.css
If you set the compatibility-version compiler option to 4.0.0, Flex applies the MXCharts.css theme by default.
Navigation
Adobe, Adobe Flash Platform and Adobe Flash Player are either registered trademarks or trademarks of Adobe Systems Incorporated in the United States and/or other countries and are used by permission from Adobe. No other license to the Adobe trademarks are granted.