
OLAPDataGrid control
The OLAPDataGrid control lets you aggregate large amounts of data for easy display and interpretation. The control supports a two-dimensional grid layout, where the columns and rows of the control can display a single level of information, or you can create hierarchical rows and columns to display more complex data.
The OLAPDataGrid controls is a subclass of the AdvancedDataGrid control, and therefore supports many of the features of the AdvancedDataGrid control. For more information on the AdvancedDataGrid control, see AdvancedDataGrid control.
About OLAP data grids
When working with large amounts of data, you can quickly get overwhelmed with the scope and size of the data. For example, you collect sales information for different products, in different regions, and for different customers in a typical two-dimensional spreadsheet. That spreadsheet could easily contain hundreds of rows and tens or even hundreds of columns. Extracting useful information for such a large data collection can be difficult, and trying to identify trends or other patterns in the data can be even harder.
Data visualization is a technique for examining large amounts of data in a compact format. One type of data visualization technique is to use a chart, such as a bar, column, or pie chart. Flex supports many types of charts. For more information, see Introduction to charts.
Another data visualization technique is to aggregate the data in a compact format, such as in an OLAP (online analytical processing) data grid. An OLAP data grid is similar to a pivot table in Microsoft Excel. An OLAP data grid displays data aggregations in a two-dimensional grid of rows and columns, like a spreadsheet, but the data is condensed based on your aggregation settings.
For example, you collect sales information on a server in a flat data structure of records, where each record contains information for a single customer transaction, for a single product, in a single quarter. The following code shows the format of this flat data:
  data:Object = {
 	customer:"AAA",
 	product:"FlexJS",
 	year:"2007",
 	quarter:"Q1"
 	revenue: "100.00"
 }
For a large company with hundreds of customers and tens or hundreds of products, this table could easily contain several thousand rows. Rather than display this information in a standard spreadsheet, you download your data to a Flex application to aggregate sales data by product and quarter, and then display the aggregated data in an OLAP data grid. From this data aggregation, you can determine trends in sales of each product over time.
About the OLAPDataGrid control
You use the Flex OLAPDataGrid control to display an OLAP data grid. The following image shows the OLAPDataGrid control displaying the aggregated sales information for product and quarter:
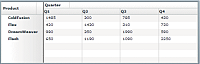
Like all Flex data grid controls, the OLAPDataGrid control is designed to display data in a two-dimensional representation of rows and columns.
You can modify this example to compare quarterly sales from two different years, as the following example shows:
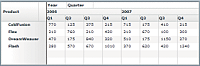
In the previous figure, the columns of the OLAPDataGrid control show a hierarchy of information for year and quarter. You can add multiple-level hierarchies for both the columns and the rows of the control.
About creating an OLAP data grid
The following figure shows the data flow that you use to aggregate your data for display in the OLAPDataGrid control:
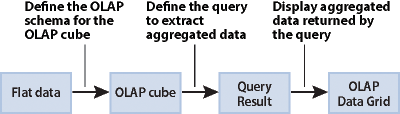
The following steps describe this process in more detail:
-
Start with flat data, which is typically data arranged as a set of records where each record contains the same data fields. For example, you might start with flat data from a spreadsheet, or with data from a table of a relational database.
The following code shows an example format of flat data:
data:Object = { customer:"AAA", product:"FlexJS", quarter:"Q1" revenue: "100.00" } -
Define an OLAP schema that describes how your data gets transformed from a flat representation into an OLAP cube. An OLAP schema defines the representation of your flat data in an OLAP cube, and defines how to aggregate your data for an OLAP query.
An OLAP cube is analogous to a table in a relational database. But whereas a table typically has two dimensions (row and column), an OLAP cube can have any number of dimensions. In this example, the cube has three dimensions: customer, product, and quarter. Every possible set of values for customer, product, and quarter defines a unique point in the cube. The value at each point in the cube is the sales revenue for that set of values of customer, product, and quarter.
-
Create queries to extract aggregated data from the OLAP cube for display in the OLAPDataGrid control.
After your data is in an OLAP cube, you write queries to extract aggregated data for display in the OLAPDataGrid control. You can write multiple queries to create different types of data aggregations.
-
Use the query results as input to the OLAPDataGrid control to display the results.
About OLAP cubes
An OLAP cube can have any number of dimensions. In its simplest form, the dimensions of an OLAP cube correspond to a field of the flat data set. For example, you have flat data that contains three fields:
  data:Object = {
 	product:"FlexJS"
 	quarter :"Q1"
 	revenue: "100.00",
 }
The data fields of each record can contain the following values:
-
The product field can have the values: FlexJS, Flex, Installer, and TourDeFlex.
-
The quarter field can have the values: Q1, Q2, Q3, and Q4.
-
The revenue field contains the sales, in dollars, of the product for the quarter.
To aggregate your data, you create an OLAP cube with two dimensions: quarter and product. The value along each dimension of the cube is called a member. For example, the product dimension of the cube has the following members: FlexJS, Flex, Installer, and TourDeFlex. For the quarter dimension, the members are Q1, Q2, Q3, and Q4.
The value at any point in the cube defined by the two dimensions is called a measure of the cube. For example, the measure at the point in the cube defined by (Q1, FlexJS) is 100.00. A schema can define one or more measures for a single point in the OLAP cube.
Flex supports only numeric values for the measure of a cube. The advantage of numeric values is that they can be easily aggregated for display in the OLAPDataGrid control. Some typical aggregation types include sum, average, minimum, and maximum. For example, you specify the aggregation method of the revenue measure as SUM. You then extract sales information from the cube for FlexJS. The aggregated sales data contains the sum of all FlexJS sales for each quarter.
About OLAP schemas
To convert flat data into an OLAP cube, you create an OLAP schema that defines the dimensions of the cube, the fields of the flat data that supply the members along each dimension, and the fields of the flat data that supply the measure for any point in the cube.
For example, you have the following flat data that contains sales records:
  data:Object = {
 	customer:"AAA",
 	product:"FlexJS",
 	quarter:"Q1"
 	revenue: "100.00"
 }
The following example shows the definition for an OLAPCube that includes the definition of the OLAP schema used to represent this data in the cube. This schema defines a three-dimensional OLAP cube based on the customer, product, and quarter fields of the data.
<mx:OLAPCube name="FlatSchemaCube"
    dataProvider="{flatData}"
    id="myMXMLCube"
    complete="runQuery(event);">

    <mx:OLAPDimension name="CustomerDim">
        <mx:OLAPAttribute name="Customer" dataField="customer"/>
        <mx:OLAPHierarchy name="CustomerHier" hasAll="true">
            <mx:OLAPLevel attributeName="Customer"/>
        </mx:OLAPHierarchy>
    </mx:OLAPDimension>

    <mx:OLAPDimension name="ProductDim">
        <mx:OLAPAttribute name="Product" dataField="product"/>
        <mx:OLAPHierarchy name="ProductHier" hasAll="true">
            <mx:OLAPLevel attributeName="Product"/>
        </mx:OLAPHierarchy>
    </mx:OLAPDimension>

    <mx:OLAPDimension name="QuarterDim">
        <mx:OLAPAttribute name="Quarter" dataField="quarter"/>
        <mx:OLAPHierarchy name="QuarterHier" hasAll="true">
            <mx:OLAPLevel attributeName="Quarter"/>
        </mx:OLAPHierarchy>
    </mx:OLAPDimension>

    <mx:OLAPMeasure name="Revenue"
        dataField="revenue"
        aggregator="SUM"/>
</mx:OLAPCube>
Notice that in this schema:
-
All dimensions are defined first, and then all measures.
-
The first line of each dimension associates a data field of the flat data with an OLAPAttribute instance. You then use the OLAPLevel.attributeName property to associate the attribute with a level of the dimension to populate the members of the dimension. For example, in this schema you populate the Customer level of the CustomerDim dimension with the data from the customer field of the data.
-
A dimension of an OLAP schema always contains a hierarchy of one or more levels. In this schema, the hierarchy of each dimension contains only a single level corresponding to a field of the flat data. This is the simplest form of a dimension. Other schemas could define multiple levels in a hierarchy to create a complex dimension. For more information, see Creating an OLAP schema.
-
A measure definition specifies the data field of the flat data that contains the value for each point in the OLAP cube, and how the measure is aggregated by an OLAP query. In this example, you aggregate revenue by summing it. That means all queries of this OLAP cube will return revenue summations. Other types of aggregation methods include maximum, minimum, and average.
-
This definition of the OLAPCube specifies an event handler for the complete event. You cannot invoke a query on the cube until it completes initialization, which is signalled by the cube when it dispatches the complete event.
Based on the requirements of your application, you might create multiple OLAP cubes from the same flat data set, where each cube uses a different schema to create its own arrangement of dimensions and measures. For more information and examples of OLAP schemas, see Creating an OLAP schema.
About OLAP queries
OLAP queries extract aggregated data from an OLAP cube for display in an OLAPDataGrid control. The query specifies the dimensions that define the characteristics of the query, and the measure or measures aggregated to create the query results.
In the previous section, you defined an OLAP schema for sales information where the schema defines CustomerDim, ProductDim, and QuarterDim dimensions, and a single measure for revenue aggregated by the SUM aggregation method. Therefore, you can create a query to sum revenue by the following criteria:
-
Product for each quarter
-
Customer for each product
-
Customer for each quarter
-
Any other combination of members from each dimension
You construct a query in ActionScript as an instance of the OLAPQuery class, and then execute the query by calling the OLAPCube.execute() method, which returns an instance of the AsyncToken class.
A query is required to have two axes, a row axis and a column axis, of type IOLAPQueryAxis. The row axis defines the data aggregation information for each row of the OLAPDataGrid control, and the column axis defines the data aggregation information for each column of the control.
You use the OLAPSet class to specify the data aggregation information for each axis, as the following example shows:
  // Create an instance of OLAPQuery to represent the query.
 var query:OLAPQuery = new OLAPQuery;

 // Get the row axis from the query instance.
 var rowQueryAxis:IOLAPQueryAxis = query.getAxis(OLAPQuery.ROW_AXIS);
 // Create an OLAPSet instance to configure the axis.
 var productSet:OLAPSet = new OLAPSet;
 // Add the Product to the row to aggregate data
 // by the Product dimension.
 productSet.addElements(
 	cube.findDimension("ProductDim").findAttribute("Product").children);
 // Add the OLAPSet instance to the axis.
 rowQueryAxis.addSet(productSet);

 // Get the column axis from the query instance, and configure it
 // to aggregate the columns by the Quarter dimension.
 var colQueryAxis:IOLAPQueryAxis = query.getAxis(OLAPQuery.COLUMN_AXIS);
 var quarterSet:OLAPSet= new OLAPSet;
 quarterSet.addElements(
 	cube.findDimension("QuarterDim").findAttribute("Quarter").children);
 colQueryAxis.addSet(quarterSet);

 // Execute the query.
 var token:AsyncToken = cube.execute(query);
 // Set up handlers for the query results.
 token.addResponder(new AsyncResponder(showResult, showFault));
Notice that in this query:
-
You initialize each axis by calling the OLAPQuery.getAxis() method.
-
You configure each OLAPSet instance by calling the OLAPSet.addElements() method to specify the information used to populate the axis.
-
You set up two functions to handle the query result defined by the AsyncToken class. In this example, the function showResult() handles the query results when the query succeeds, and the function showFault() handles any errors detected during query execution. For more information on using the AsyncToken class, see Executing a query and returning the results to an OLAPDataGrid control.
For more information and examples of OLAP queries, see Creating OLAP queries.
The differences between the OLAPDataGrid and the AdvancedDataGrid control
You use the OLAPDataGrid control to display the results of an OLAP query. The OLAPDataGrid control is a subclass of the AdvancedDataGrid control and inherits much of its functionality. However, because of the way you pass data to the OLAPDataGrid control, it has several differences from the AdvancedDataGrid control:
-
Column dragging is not allowed in the OLAPDataGrid control.
-
You cannot edit cells in the OLAPDataGrid control because cell data is a result of a query and does not correspond to a single data value in the OLAP cube.
-
You cannot sort columns by clicking on headers in the OLAPDataGrid control. Sorting is supported at the dimension level so that you can change the order of members of that dimension. Note that you can only use sorting while preparing the query, and then use it to get the member names displayed along the rows and column headers.
You populate an OLAPDataGrid control with data by setting its data provider to an instance of the OLAPResult class, which contains the results of an OLAP query. For a complete example that uses this control, see Example using the OLAPDataGrid control.
Example using the OLAPDataGrid control
The following example shows the complete code for creating the OLAPDataGrid control that appears in the section About OLAP data grids. This example aggregates product sales by quarter. The example uses flat data from the dataIntro.as file, which contains sales records in the following format:
  data:Object = {
 	customer:"AAA",
 	product:"FlexJS",
 	quarter:"Q1"
 	revenue: "100.00"
 }
The following code implements this example:
<?xml version="1.0"?>
<!-- olapdatagrid/OLAPDG_Intro.mxml -->
<s:Application xmlns:fx="http://ns.adobe.com/mxml/2009"
    xmlns:mx="library://ns.adobe.com/flex/mx"
    xmlns:s="library://ns.adobe.com/flex/spark"
        creationComplete="creationCompleteHandler();">

    <fx:Script>
      <![CDATA[
        import mx.rpc.AsyncResponder;
        import mx.rpc.AsyncToken;
        import mx.rpc.events.FaultEvent;
        import mx.olap.OLAPQuery;
        import mx.olap.OLAPSet;
        import mx.olap.IOLAPQuery;
        import mx.olap.IOLAPQueryAxis;
        import mx.olap.IOLAPCube;
        import mx.olap.OLAPResult;
        import mx.events.CubeEvent;
        import mx.controls.Alert;
        import mx.collections.ArrayCollection;

        include "dataIntro.as"

        private function creationCompleteHandler():void {
            // You must initialize the cube before you
            // can execute a query on it.
            myMXMLCube.refresh();
        }

        // Create the OLAP query.
        private function getQuery(cube:IOLAPCube):IOLAPQuery {
            // Create an instance of OLAPQuery to represent the query.
            var query:OLAPQuery = new OLAPQuery;

            // Get the row axis from the query instance.
            var rowQueryAxis:IOLAPQueryAxis =
                query.getAxis(OLAPQuery.ROW_AXIS);
            // Create an OLAPSet instance to configure the axis.
            var productSet:OLAPSet = new OLAPSet;
            // Add the Product to the row to aggregate data
            // by the Product dimension.
            productSet.addElements(
                cube.findDimension("ProductDim").findAttribute("Product").children);
            // Add the OLAPSet instance to the axis.
            rowQueryAxis.addSet(productSet);

            // Get the column axis from the query instance, and configure it
            // to aggregate the columns by the Quarter dimension.
            var colQueryAxis:IOLAPQueryAxis =
                query.getAxis(OLAPQuery.COLUMN_AXIS);
            var quarterSet:OLAPSet= new OLAPSet;
            quarterSet.addElements(
                cube.findDimension("QuarterDim").findAttribute("Quarter").children);
            colQueryAxis.addSet(quarterSet);

            return query;
        }

        // Event handler to execute the OLAP query
        // after the cube completes initialization.
        private function runQuery(event:CubeEvent):void {
            // Get cube.
            var cube:IOLAPCube = IOLAPCube(event.currentTarget);
            // Create a query instance.
            var query:IOLAPQuery = getQuery(cube);
            // Execute the query.
            var token:AsyncToken = cube.execute(query);
            // Set up handlers for the query results.
            token.addResponder(new AsyncResponder(showResult, showFault));
        }

        // Handle a query fault.
        private function showFault(error:FaultEvent, token:Object):void {
            Alert.show(error.fault.faultString);
        }

        // Handle a successful query by passing the query results to
        // the OLAPDataGrid control..
        private function showResult(result:Object, token:Object):void {
            if (!result) {
                Alert.show("No results from query.");
                return;
            }
            myOLAPDG.dataProvider= result as OLAPResult;
        }
      ]]>
    </fx:Script>

    <fx:Declarations>
        <mx:OLAPCube name="FlatSchemaCube"
            dataProvider="{flatData}"
            id="myMXMLCube"
            complete="runQuery(event);">

            <mx:OLAPDimension name="CustomerDim">
                <mx:OLAPAttribute name="Customer" dataField="customer"/>
                <mx:OLAPHierarchy name="CustomerHier" hasAll="true">
                    <mx:OLAPLevel attributeName="Customer"/>
                </mx:OLAPHierarchy>
            </mx:OLAPDimension>

            <mx:OLAPDimension name="ProductDim">
                <mx:OLAPAttribute name="Product" dataField="product"/>
                <mx:OLAPHierarchy name="ProductHier" hasAll="true">
                    <mx:OLAPLevel attributeName="Product"/>
                </mx:OLAPHierarchy>
            </mx:OLAPDimension>

            <mx:OLAPDimension name="QuarterDim">
                <mx:OLAPAttribute name="Quarter" dataField="quarter"/>
                <mx:OLAPHierarchy name="QuarterHier" hasAll="true">
                    <mx:OLAPLevel attributeName="Quarter"/>
                </mx:OLAPHierarchy>
            </mx:OLAPDimension>

            <mx:OLAPMeasure name="Revenue"
                dataField="revenue"
                aggregator="SUM"/>
        </mx:OLAPCube>
    </fx:Declarations>

    <mx:OLAPDataGrid id="myOLAPDG" width="100%" height="100%"/>
</s:Application>
Creating an OLAP schema
An OLAP schema defines the representation of your flat data in an OLAP cube, and defines how to aggregate your data for an OLAP query. You typically define your schema in MXML. While you can construct a schema programmatically in ActionScript, that method requires much more coding than MXML.
The following table describes the classes and interfaces that you use to define an OLAP schema:
|
Class |
Interface |
Description |
|---|---|---|
|
OLAPSchema |
IOLAPSchema |
The schema instance. |
|
OLAPCube |
IOLAPCube |
The OLAP cube created by the schema. |
|
OLAPDimension |
IOLAPDimension |
A dimension of the schema. |
|
OLAPAttribute |
IOLAPAttribute |
An attribute of a dimension |
|
OLAPHierarchy |
IOLAPHierarchy |
A hierarchy of a dimension. |
|
OLAPLevel |
IOLAPLevel |
A level of a hierarchy. |
|
OLAPMeasure |
IOLAPMeasure |
A measure of a dimension. |
General form of a schema definition
In MXML, you can define an OLAP schema as part of the definition of an OLAPCube instance. In MXML, you declare an OLAPCube in an <fx:Declarations> tag because it is not a visual component.
Typically, you set any properties of the OLAPCube instance as tag attributes, and set the OLAPCube.dimensions and OLAPCube.measures properties as child tags, as the following example shows:
<fx:Declarations>
	  <mx:OLAPCube name="FlatSchemaCube"
 		dataProvider="{flatData}"
 		id="myMXMLCube"
 		complete="runQuery(event);">

 		<!-- Define dimensions. -->
 		<mx:OLAPDimension ... />

	 	<mx:OLAPDimension ... />
	 	...

	 	<!-- Define measures. -->
	 	<mx:OLAPMeasure ... />
	 	...
	 </mx:OLAPCube>
</fx:Declarations>
The order of the OLAPDimension and OLAPMeasure definitions is not important, but you should not place OLAPMeasure definitions between OLAPDimension definitions.
Specifying the aggregation method for a measure
As part of creating an OLAP schema, you specify the data field that provides the value of the measure for each point in the cube. The measure corresponds to the data value at that point in the OLAP cube. For example, if you define a schema for sales information, you might specify as a measure of the cube the revenue for a product, and the aggregation type as SUM.
A schema can define one or more measures for a single point in the OLAP cube. The first measure in the schema is called the default measure, and is the measure returned by an OLAP query when you do not explicitly specify the measure to return. For more information on selecting a specific measure, see Creating a query using a nondefault measure.
The following example shows a section of an MXML schema definition that specifies two measures for the schema:
  <mx:OLAPMeasure name="Revenue" dataField="revenue" aggregator="SUM"/>
 <mx:OLAPMeasure name="Cost" dataField="cost" aggregator="SUM"/>
When creating a schema, you specify the name of the measure, the data field in the input flat data that contains the data for the measure, and an aggregation method of the measure. In this example, the aggregation method is SUM. That means when you create an OLAP query for a measure, the query sums all revenue fields to generate the values displayed by the OLAPDataGrid control. You could use this schema to define a cube so that you can total sales and cost information for products, regions, and other characteristics of your data.
To aggregate the revenue data using a different aggregation method, such as average or maximum, create another schema to define a second OLAP cube. The following example shows a section of another MXML schema definition that specifies the aggregation method as MAX for the sales data and MIN for the cost data:
  <mx:OLAPMeasure name="Revenue" dataField="revenue" aggregator="MAX"/>
 <mx:OLAPMeasure name="Cost" dataField="cost" aggregator="MIN"/>
You should take care in how you define your schema because it can limit the types of queries that you can run on it, or the level of detail at which you can create aggregations.
Creating a schema dimension
An OLAPSchema instance can define any number of dimensions, limited only by your input data. A dimension can be a simple dimension with a single level, or it can be a complex dimension with multiple levels. The dimension of a schema always has the same basic form:
  <mx:OLAPDimension name="QuarterDim">
 	<mx:OLAPAttribute name="Quarter" dataField="quarter"/>
 	...
 	<mx:OLAPHierarchy name="QuarterHier" hasAll="true">
 		<mx:OLAPLevel attributeName="Quarter"/>
 		...
 	</mx:OLAPHierarchy>
 </mx:OLAPDimension>
Notice that in this schema:
-
The dimension first uses OLAPAttribute class to specify the data fields of the input data set used to populate the members of the dimension.
The dimension defines an instance of the OLAPHierarchy class. Therefore, a dimension is always assumed to contain a hierarchy of levels, even if that hierarchy contains only a single level.
-
The dimension specifies one or more instances of the OLAPLevel class to associate a field of the input with the dimension.
Defining a dimension that contains a single level
To create a simple dimension (a dimension that contains a single level), you define a dimension hierarchy, as the following example shows:
  <mx:OLAPDimension name="CustomerDim">
 	<mx:OLAPAttribute name="Customer" dataField="customer"/>
 	<mx:OLAPHierarchy name="CustomerHier" hasAll="true">
 		<mx:OLAPLevel attributeName="Customer"/>
 	</mx:OLAPHierarchy>
 </mx:OLAPDimension>
In this example, the customer field of the input data defines the entire measure of the dimension.
Defining a dimension that contains multiple levels
Instead of creating a separate dimension for each field of your data, you can choose to group related data fields along a single dimension. For example, your data might contain several fields related to the time of a transaction, such as month, quarter, and year. Or your data might contain multiple fields associated with the geographical area of a transaction, such as region, state, province, or country.
The TimeDim dimension in the following example defines hierarchical dimensions that contain two levels, one for year and one for quarter:
  <mx:OLAPCube name="FlatSchemaCube"
 	dataProvider="{flatData}"
 	id="myMXMLCube">

 	<mx:OLAPDimension name="TimeDim">
 		<mx:OLAPAttribute name="Year" dataField="year"/>
 		<mx:OLAPAttribute name="Quarter" dataField="quarter"/>
 		<mx:OLAPHierarchy name="Time-PeriodHier" hasAll="true">
 			<mx:OLAPLevel attributeName="Year"/>
 			<mx:OLAPLevel attributeName="Quarter"/>
 		</mx:OLAPHierarchy>
 	</mx:OLAPDimension>

 	<mx:OLAPMeasure name="Revenue"dataField="revenue" aggregator="SUM"/>
 </mx:OLAPCube>
With this schema definition, you can aggregate data for all time, for individual years, for individual quarters, or for individual quarters of a specific year.
Notice that the TimeDim dimension contains a Year level, the most general level, and a Quarter level, the more detailed level. The first level in the hierarchy typically defines the most general level, and each subsequent level provides a greater level of detail.
If your data contained a month field with the month of the year for a transaction, you can add the Month level to the TimeDim dimension. Since month is a more detailed measure of time than quarter, add the Month level after the Quarter level, as the following example shows:
  <mx:OLAPDimension name="TimeDim">
 	<mx:OLAPAttribute name="Year" dataField="year"/>
 	<mx:OLAPAttribute name="Quarter" dataField="quarter"/>
 	<mx:OLAPAttribute name="Month" dataField="month"/>
 	<mx:OLAPHierarchy name="Time-PeriodHier" hasAll="true">
 		<mx:OLAPLevel attributeName="Year"/>
 		<mx:OLAPLevel attributeName="Quarter"/>
 		<mx:OLAPLevel attributeName="Month"/>
 	</mx:OLAPHierarchy>
 </mx:OLAPDimension>
The advantage of creating a hierarchical schema is that you can write queries to extract top-level data aggregations or to drill down into the data to extract more granular data. For the previous schema definition, you can write an OLAP query to aggregate data by the most general field, such as year, or drill down to obtain more granular results by aggregating your data by quarter in each year, by month in each quarter, or by month in each year.
Creating a default member in a schema
Most of the OLAP schemas shown so far have been defined in the following form:
  <mx:OLAPDimension name="TimeDim">
 	<mx:OLAPAttribute name="Year" dataField="year"/>
 	<mx:OLAPAttribute name="Quarter" dataField="quarter"/>
 	<mx:OLAPHierarchy name="Time-PeriodHier" hasAll="true">
 		<mx:OLAPLevel attributeName="Year"/>
 		<mx:OLAPLevel attributeName="Quarter"/>
 	</mx:OLAPHierarchy>
 </mx:OLAPDimension>
In this schema, the hierarchy sets the OLAPHierarchy.hasAll property to true to create a default member for the hierarchy. The default member is created automatically for the hierarchy and contains an aggregation of all levels in the hierarchy. In the previous schema, the default member contains an aggregation of the measure of the schema for all years and all quarters.
The default member is used by OLAP queries when you do not specify any criteria to aggregate the dimension. For example, your OLAP schema contains a ProductDim, TimeDim, and CustomerDim dimension. You then write a query to extract data by product and customer, but omit any specification in the query for time. The OLAP query automatically uses the default member of the dimension to aggregate the information for the TimeDim dimension.
The default value of the OLAPHierarchy.hasAll property is true. If you set it to false, the OLAP query uses the first level in the hierarchy to aggregate the dimension. The following schema sets the hasAll property to false:
  <mx:OLAPDimension name="TimeDim">
 	<mx:OLAPAttribute name="Year" dataField="year"/>
 	<mx:OLAPAttribute name="Quarter" dataField="quarter"/>
 	<mx:OLAPHierarchy name="Time-PeriodHier" hasAll="false">
 		<mx:OLAPLevel attributeName="Year"/>
 		<mx:OLAPLevel attributeName="Quarter"/>
 	</mx:OLAPHierarchy>
 </mx:OLAPDimension>
Because the hasAll property is false, an OLAP query automatically aggregates the data in the dimension by the Year level when you omit the TimeDim dimension from the query.
By default, the OLAP cube adds a member to the dimension named (All) to represent the default member. You can use the OLAPHierarchy.allLevelName property to specify a different name, as the following example shows:
  <mx:OLAPDimension name="TimeDim">
 	<mx:OLAPAttribute name="Year" dataField="year" allLevelname="AllTime"/>
 	<mx:OLAPAttribute name="Quarter" dataField="quarter"/>
 	<mx:OLAPHierarchy name="Time-PeriodHier" hasAll="true">
 		<mx:OLAPLevel attributeName="Year"/>
 		<mx:OLAPLevel attributeName="Quarter"/>
 	</mx:OLAPHierarchy>
 </mx:OLAPDimension>
When you execute an OLAP query, you choose whether or not to include the default member in the query results. For more information, see Using the default member in a query.
Creating OLAP queries
You use an OLAP query to extract data from an OLAP cube for display by the OLAPDataGrid control. An OLAP query defines a result set in a two-dimensional table of rows and columns so that the data can be viewed in the OLAPDataGrid control.
The following table describes the classes and interfaces that you use the define a query:
|
Class |
Interface |
Description |
|---|---|---|
|
AsyncToken |
|
The result of the OLAPQuery.execute() method. |
|
OLAPCell |
IOLAPCell |
An area of the cube defined by a tuple. |
|
OLAPMember |
IOLAPMember |
A member of a dimension. |
|
OLAPQuery |
IOLAPQuery |
The query instances. |
|
OLAPQueryAxis |
IOLAPQueryAxis |
An axis of the query. |
|
OLAPResult |
IOLAPResult |
The query result. |
|
OLAPSet |
|
A set of members for an axis. |
|
OLAPTuple |
IOLAPTuple |
A tuple containing one or more members. |
Creating a query
The process of creating a query has the following steps:
-
Prepare the cube for a query. For more information, see Preparing a cube for a query.
-
Define an instance of the OLAPQuery class to represent the query. For more information, see Creating a query axis.
-
Define an instance of the OLAPQueryAxis class to represent the rows of the query.
-
Define an instance of the OLAPSet class to define the members that provide the row axis information. For more information, see Writing a query for a simple OLAP cube and Writing a query for a complex OLAP cube.
-
Define an instance of the OLAPQueryAxis class to represent the columns of the query.
-
Define an instance of the OLAPSet class to define the members that provide the axis column information.
-
Optionally define an instance of the OLAPQueryAxis class to specify a slicer axis. For more information, see Creating a slicer axis
-
Define an instance of the OLAPSet class to define the members that provide the slicer axis information.
-
Execute the query on the cube by calling OLAPCube.execute(). For more information, see Executing a query and returning the results to an OLAPDataGrid control.
-
Pass the query results to the OLAPDataGrid control.
Preparing a cube for a query
Before you can run the first query on an OLAP cube, you must call the OLAPCube.refresh() method to initialize the cube from the input data. Upon completion of cube initialization, the OLAP cube dispatches the complete event to signal that the cube is ready for you to query.
You can use event handlers to initialize the cube and to invoke the query. The following example uses the application's creationComplete event to initialize the cube, and then uses the cube's complete event to execute the query:
  <s:Application xmlns:fx="http://ns.adobe.com/mxml/2009"
	xmlns:mx="library://ns.adobe.com/flex/mx"
	xmlns:s="library://ns.adobe.com/flex/spark"
 	creationComplete="creationCompleteHandler();">

 <fx:Script>
 	<![CDATA[

 		private function creationCompleteHandler():void {
 			// You must initialize the cube before you
 			// can execute a query on it.
 			myMXMLCube.refresh();
 		}

 		// Event handler to execute the OLAP query
 		// after the cube completes initialization.
 		private function runQuery(event:CubeEvent):void {
 			...
 		}
 	]]>
 </fx:Script>
<fx:Dclarations>
	 <mx:OLAPCube name="FlatSchemaCube"
	 	dataProvider="{flatData}"
	 	id="myMXMLCube"
	 	complete="runQuery(event);">
	 	...
	 </mx:OLAPCube>
</fx:Declarations>

...
  </s:Application>
Creating a query axis
The following example shows an OLAPDataGrid control containing the results of a query for the sales of different products for different quarters:
To create a query, you must define a row axis, a column axis, and optionally a slicer axis, where each axis is an instance of the IOLAPQueryAxis interface. The following table describes the different types of axes:
|
Axis |
Description |
|---|---|
|
Row |
Defines the data that appears in each row of the OLAPDataGrid control. In the previous image, you define the row to show each product. This axis is required. |
|
Column |
Defines the data displayed in the column. In the previous image, you define the columns to show each year. This axis is required. |
|
Slicer |
Optionally defines a filter to reduce the size of the query results, often to reduce the dimensionality of the results from a dimension greater than two so that you can display the results in an OLAPDataGrid control. You also use a slicer access to return data aggregations for the nondefault measure. For more information on using a slicer axis, see Creating a slicer axis. |
When you construct the OLAPQueryAxis instance, you use the OLAPQuery.getAxis() method to initialize the axis to configure it as either a row, column, or slicer axis, as the following example shows:
  	// Create an instance of OLAPQuery to represent the query.
 	var query:OLAPQuery = new OLAPQuery;

 	// Get the row axis from the query instance.
 	var rowQueryAxis:IOLAPQueryAxis = 	query.getAxis(OLAPQuery.ROW_AXIS);
 	// Create an OLAPSet instance to configure the axis.
 	...

 	var colQueryAxis:IOLAPQueryAxis = 	query.getAxis(OLAPQuery.COLUMN_AXIS);
 	...
Populating a query axis
You use the OLAPSet class to specify the members of the dimensions of the OLAP cube that populate a query axis. To add a member to an OLAPSet instance, you call the OLAPSet.addElement() or OLAPSet.addElements() method. The following table describes these methods:
|
OLAPSet method |
Description |
|---|---|
addElement(e:IOLAPElement):void |
Adds a single element to the set.
|
addElements(members:IList):void |
Adds multiple elements to the set. |
For more information, see Writing a query for a simple OLAP cube and Writing a query for a complex OLAP cube.
Executing a query and returning the results to an OLAPDataGrid control
OLAP cubes can be complex, so you do not want your application to pause while Flex calculates the results of an OLAP query. Therefore, when you execute a query, you also set up two callback functions that handle the results of the query. Flex then calls these functions when the query completes. This architecture lets the query run asynchronously so that your application can continue to execute during query processing.
You execute a query by calling the OLAPCube.execute() method, where the OLAPCube.execute() method returns an instance of the AsyncToken class. You use the AsyncToken class, along with the AsyncResponder class, to specify the two callback functions to handle the query results when execution completes.
In this example, the function showResult() handles the query results when the query succeeds, and the function showFault() handles any errors detected during query execution:
  <s:Application xmlns:fx="http://ns.adobe.com/mxml/2009"
	xmlns:mx="library://ns.adobe.com/flex/mx"
	xmlns:s="library://ns.adobe.com/flex/spark"
	creationComplete="creationCompleteHandler();">

 <fx:Script>
 	<![CDATA[

 		private function creationCompleteHandler():void {
 			// You must initialize the cube before you
 			// can execute a query on it.
 			myMXMLCube.refresh();
 		}

 		// Create the OLAP query.
 		private function getQuery(cube:IOLAPCube):IOLAPQuery {
 			...
 		}

 		// Event handler to execute the OLAP query
 		// after the cube completes initialization.
 		private function runQuery(event:CubeEvent):void {
 			// Get cube.
 			var cube:IOLAPCube = IOLAPCube(event.currentTarget);
 			// Create a query instance.
 			var query:IOLAPQuery = getQuery(cube);
 			// Execute the query.
 			var token:AsyncToken = cube.execute(query);
 			// Set up handlers for the query results.
 			token.addResponder(new AsyncResponder(showResult, showFault));
 		}

 		// Handle a query fault.
 		private function showFault(error:ErrorMessage, token:Object):void {
 			Alert.show(error.faultString);
 		}

 		// Handle a query success.
 		private function showResult(result:Object, token:Object):void {
 			if (!result) {
 				Alert.show("No results from query.");
 				return;
 			}

 			myOLAPDG.dataProvider= result as OLAPResult;
 		}
 	]]>
 </fx:Script>

<fx:Declarations>
	 <mx:OLAPCube name="FlatSchemaCube"
	 	dataProvider="{flatData}"
	 	id="myMXMLCube"
	 	complete="runQuery(event);">
	 	...
	 </mx:OLAPCube>
<fx:Declarations>

 <mx:OLAPDataGrid id="myOLAPDG" width="100%" height="100%" />

</s:Application>
Using the default member in a query
Many of the queries shown so far have referenced only two dimensions of the OLAP cube, such as ProductDim and TimeDim. But what happens to the other dimensions when you omit them from the query?
All dimensions have a default member, either explicit or implicit. When you execute a query that does not reference a dimension, the query aggregates the data for that dimension using the default member. For information on defining the default member of a schema, see Creating a default member in a schema.
Specifying a default cell string for the OLAPDataGrid control
When you define your query, you might create a situation where a cell of the OLAPDataGrid does not contain a value. For example, when aggregating data by customer and product, you might have a customer that has never purchased TourDeFlex. For that customer and product combination, the corresponding cell of the OLAPDataGrid displays the String "NaN".
You can customize this String by setting the OLAPDataGrid.defaultCellString. For example, if you want to set the String to "No value", you would create an OLAPDataGrid control as shown here:
  <mx:OLAPDataGrid id="myOLAPDG"
 	defaultCellString="No value"
 	width="100%" height="100%"/>
Writing a query for a simple OLAP cube
In a simple OLAP cube, all of the dimensions of the cube define a single level. For example, you have flat data that contains three fields:
  data:Object = {
 	product:"FlexJS"
 	quarter :"Q1"
 	revenue: "100.00",
 }
The data fields of each record can contain the following values:
-
The product field can have the values: FlexJS, Flex, Installer, and TourDeFlex.
-
The quarter field can have the values: Q1, Q2, Q3, and Q4.
The OLAP schema for this data defines two dimensions, each with a single level, as the following code shows:
  <mx:OLAPCube name="FlatSchemaCube"
 	dataProvider="{flatData}"
 	id="myMXMLCube"
 	complete="runQuery(event);">

 	<mx:OLAPDimension name="ProductDim">
 		<mx:OLAPAttribute name="Product" dataField="product"/>
 		<mx:OLAPHierarchy name="ProductHier" hasAll="true">
 			<mx:OLAPLevel attributeName="Product"/>
 		</mx:OLAPHierarchy>
 	</mx:OLAPDimension>

 	<mx:OLAPDimension name="QuarterDim">
 		<mx:OLAPAttribute name="Quarter" dataField="quarter"/>
 		<mx:OLAPHierarchy name="QuarterHier" hasAll="true">
 			<mx:OLAPLevel attributeName="Quarter"/>
 		</mx:OLAPHierarchy>
 	</mx:OLAPDimension>

 	<mx:OLAPMeasure name="Revenue"
 		dataField="revenue"
 		aggregator="SUM"/>
 </mx:OLAPCube>
After you call the OLAPCube.refresh() method to initialize the cube, it has the following structure:
  ProductDim 							// Dimension
 	Product 							// Hierarchy
 		(All)							// Member
 		FlexJS							// Member
 		Flex							// Member
 		Installer							// Member
 		TourDeFlex							// Member

 	ProductHier 							// Hierarchy
 		(All)							// Level
 			FlexJS							// Member
 			Flex							// Member
 			Installer							// Member
 			TourDeFlex							// Member

 		Product 							// Level
 			FlexJS							// Member
 			Flex							// Member
 			Installer							// Member
 			TourDeFlex							// Member

 QuarterDim 							// Dimension
 	Quarter 							// Hierarchy
 		(All)							// Member
 		Q1							// Member
 		Q2							// Member
 		Q3							// Member
 		Q4							// Member

 	QuarterHier 							// Hierarchy
 		(All)							// Level
 			Q1							// Member
 			Q2							// Member
 			Q3							// Member
 			Q4							// Member

 		Quarter							// Level
 			Q1							// Member
 			Q2							// Member
 			Q3							// Member
 			Q4							// Member
Notice in this cube:
-
The ProductDim dimension contains two hierarchies: Product and ProductHier. The cube creates a hierarchy for each level specified by the OLAPLevel class, and for each hierarchy specified by the OLAPHierarchy class. The same is true for the QuarterDim dimension; it also contains two hierarchies.
-
The order of the members, meaning the values along each dimension, is based on the order in which the members appear in the flat data. In this example, the quarters appear in order of Q1, Q2, Q3, and Q4 because the flat data was sorted by quarter. However, if the data was not sorted by quarter, the members along the QuarterDim could appear in any order.
-
Each dimension contains a single level; therefore the (All) level contains the same data as the first level in the hierarchy. For example, the (All) level of the ProdcutHier hierarchy contains the same data as the Product level. For a complex cube, the (All) level would contain additional information.
For an example of a complex cube, see Writing a query for a complex OLAP cube.
Defining a query for a simple cube
An OLAP query has the following basic form:
  // Create an instance of OLAPQuery to represent the query.
 var query:OLAPQuery = new OLAPQuery;

 // Get the row axis from the query instance.
 var rowQueryAxis:IOLAPQueryAxis = query.getAxis(OLAPQuery.ROW_AXIS);
 // Create an OLAPSet instance to configure the axis.
 var productSet:OLAPSet = new OLAPSet;
 // Use OLAPSet.addElements() or OLAPSet.addElement() to add members to the row axis.
 productSet.addElements(...);
 // Add the OLAPSet instance to the axis.
 rowQueryAxis.addSet(productSet);

 // Get the column axis from the query instance, and configure it
 // to aggregate the columns by the Quarter dimension.
 var colQueryAxis:IOLAPQueryAxis = query.getAxis(OLAPQuery.COLUMN_AXIS);
 var quarterSet:OLAPSet= new OLAPSet;
 // Use OLAPSet.addElements() or OLAPSet.addElement() to add members to the column axis.
 productSet.addElements(...);
 colQueryAxis.addSet(quarterSet);
You use the following methods and properties to extract information from an OLAP cube based on the attributes of the dimension, and pass it to the OLAPSet.addElements() or OLAPSet.addElement() method:
|
Method and property |
Description |
|---|---|
OLAPCube.findDimension(name:String):IOLAPDimension |
Returns a dimension of a schema as an instance of the OLAPDimension class. |
OLAPDimension.findAttribute(name:String):IOLAPAttributeHierarchy |
Returns an instance of the IOLAPAttributeHierarchy interface, which is an attribute hierarchy that includes an IList instance of all members of the attribute. |
OLAPDimension.findMember(name:String):IOLAPMember |
Returns an IOLAPMember instance that represents a member with the specified name within the dimension. |
IOLAPAttributeHierarchy.children |
Contains all members of the level as an IList instance, but does not include the (All) member. |
IOLAPAttributeHierarchy.members |
Contains all members of the level as an IList instance, including the (All) member. |
The following table shows the information returned for combinations of these methods and properties:
|
Reference to method and property |
Returns |
|---|---|
findDimension("ProductDim").findAttribute("Product").children
|
FlexJS, Flex, Installer, and TourDeFlex |
findDimension("ProductDim").findAttribute("Product").members
|
(All), FlexJS, Flex, Installer, and TourDeFlex |
findDimension("ProductDim").findMember("Flex")
|
Flex |
findDimension("QuarterDim").findAttribute("Quarter").children
|
Q1, Q2, Q3, and Q4 |
findDimension("QuarterDim").findAttribute("Quarter").members
|
(All), Q1, Q2, Q3, and Q4 |
findDimension("QuarterDim").findMember("Q2")
|
Q2 |
Rather than use the findAttribute() method, you can drill down through the hierarchy of the cube by calling the following methods:
|
Method |
Description |
|---|---|
OLAPDimension.findHierarchy(name:String):IOLAPHierarchy |
Returns a hierarchy of a dimension as an instance of OLAPHierarchy. You can specify either an OLAPHierarchy or an OLAPLevel instance to this method. |
OLAPHierarchy.findLevel(name:String):IOLAPLevel |
Returns a level of a hierarchy as an instance of OLAPLevel. |
OLAPLevel.findMember(name:String):IList |
Returns an IList instance that contains all IOLAPMember instances that match the String argument. You can then use the IList.getItemAt() method to access the any element in the IList. |
The following table shows the information returned for different combinations of these methods:
|
Reference to method |
Returns |
|---|---|
findDimension("ProductDim").findhHierarchy("ProductHier"). findLevel("Product").children
|
FlexJS, Flex, Installer, and TourDeFlex |
findDimension("ProductDim").findHierarchy("ProductHier"). findLevel("Product").members
|
(All), FlexJS, Flex, Installer, and TourDeFlex |
IOLAPElement(cube.findDimension("ProductDim"). findHierarchy("ProductHier").findLevel("Product"). findMember("Flex").getItemAt(0))
|
Flex. Cast the result to an instance of IOLAPElement because getItemAt() returns an Object. |
findDimension("QuarterDim").findHierarchy("QuarterHier"). findLevel("Quarter").children
|
Q1, Q2, Q3, and Q4 |
findDimension("QuarterDim").findHierarchy("QuarterHier"). findLevel("Quarter").members
|
(All), Q1, Q2, Q3, and Q4 |
IOLAPElement(cube.findDimension("QuarterDim"). findHierarchy("QuarterHier").findLevel("Quarter"). findMember("Q2").getItemAt(0))
|
Q2. Cast the result to an instance of IOLAPElement because getItemAt() returns an Object. |
In the case of a simple cube, the OLAPDimension.findHierarchy(), OLAPHierarchy.findLevel(), and OLAPLevel.findMember() methods do not provide you with additional functionality from the OLAPDimension.findAttribute() and OLAPDimension.findMember() methods. They are more commonly used with complex cubes that contain dimensions with multiple levels. For more information, see Writing a query for a complex OLAP cube.
Add all members to an axis
The most common type of query returns a data aggregation for all members of an attribute of a schema. For example, you define an OLAP cube using a schema that contains a ProductDim and a QuarterDim dimension, as shown in the section Writing a query for a simple OLAP cube. You then want to generate a query for all products for all quarters. The following query extracts this information:
  private function getQuery(cube:IOLAPCube):IOLAPQuery {
 	// Create an instance of OLAPQuery to represent the query.
 	var query:OLAPQuery = new OLAPQuery;

 	// Get the row axis from the query instance.
 	var rowQueryAxis:IOLAPQueryAxis = query.getAxis(OLAPQuery.ROW_AXIS);
 	// Create an OLAPSet instance to configure the axis.
 	var productSet:OLAPSet = new OLAPSet;
 	productSet.addElements(
 		cube.findDimension("ProductDim").findAttribute("Product").children);
 	rowQueryAxis.addSet(productSet);

 	var colQueryAxis:IOLAPQueryAxis = query.getAxis(OLAPQuery.COLUMN_AXIS);
 	var quarterSet:OLAPSet= new OLAPSet;
 	quarterSet.addElements(
 		cube.findDimension("QuarterDim").findAttribute("Quarter").children);
 	colQueryAxis.addSet(quarterSet);

 	return query;
 }
In this example, the column axis uses the findDimension() and findAttribute() methods to drill down into the ProductDim and QuarterDim dimensions to extract sales data. For each axis, you use the IOLAPAttributeHierarchy.children property to populate it with the all members of the attribute, but do not include the (All) member.
This query uses the default measure to populate the query result, where the default measure is the first measure defined in the cube's schema. Therefore, you do have to specify the measure as part of the query. For information on explicitly specifying the measure in the query, see Creating a query using a nondefault measure.
Notice that in this example, you did not have to specify the hierarchy name, ProductHier and QuarterDim, to extract the member from the schema. It is unnecessary to specify the hierarchy name when you only want to extract data for a single level of a dimension.
However, you could rewrite this example to explicitly drill down through the cube by calling the methods OLAPDimension.findHierarchy() and OLAPHierarchy.findLevel(), as the following example shows:
  private function getQuery(cube:IOLAPCube):IOLAPQuery {
 	// Create an instance of OLAPQuery to represent the query.
 	var query:OLAPQuery = new OLAPQuery;

 	// Get the row axis from the query instance.
 	var rowQueryAxis:IOLAPQueryAxis = query.getAxis(OLAPQuery.ROW_AXIS);
 	// Create an OLAPSet instance to configure the axis.
 	var productSet:OLAPSet = new OLAPSet;
 	productSet.addElements(cube.findDimension(
 		"ProductDim").findHierarchy("ProductHier").findLevel("Product").members);
 	rowQueryAxis.addSet(productSet);

 	var colQueryAxis:IOLAPQueryAxis = query.getAxis(OLAPQuery.COLUMN_AXIS);
 	var quarterSet:OLAPSet= new OLAPSet;
 	quarterSet.addElements(
 		cube.findDimension("QuarterDim").findHierarchy("QuarterHier").
 		findLevel("Quarter").members);
 	colQueryAxis.addSet(quarterSet);

 	return query;
 }
In this example, you drill down through the dimension to access the Product and Quarter levels. You typically use this technique with complex cubes where you are interested in an explicit member of a dimension.
Add explicit members to a query
In the query shown in the previous section, you obtain sales data for all members of the Product and Quarter levels of the schema. But, what if you only want sales data for a single product, or for a single quarter? When you drill down into a dimension, you can specify the individual member of the dimension that you want to query.
For example, you want to create a query to aggregate quarterly sales data only for Flex, but not for any other products. You therefore use the OLAPDimension.findMember() method to specify the name of the member. This method takes a String containing the name of the member, and returns an IOLAPMember instance that defines the member, as the following example shows:
  private function getQuery(cube:IOLAPCube):IOLAPQuery {
 	// Create an instance of OLAPQuery to represent the query.
 	var query:OLAPQuery = new OLAPQuery;

 	// Get the row axis from the query instance.
 	var rowQueryAxis:IOLAPQueryAxis = query.getAxis(OLAPQuery.ROW_AXIS);
 	// Create an OLAPSet instance to configure the axis.
 	var productSet:OLAPSet = new OLAPSet;
 	productSet.addElement(cube.findDimension("ProductDim").findMember("Flex"));
 	rowQueryAxis.addSet(productSet);

 	var colQueryAxis:IOLAPQueryAxis =
 	query.getAxis(OLAPQuery.COLUMN_AXIS);
 	var quarterSet:OLAPSet= new OLAPSet;
 	quarterSet.addElements(
 		cube.findDimension("QuarterDim").findAttribute("Quarter").children);
 	colQueryAxis.addSet(quarterSet);

 	return query;
 }
Notice that in the previous example, you use the OLAPSet.addElement() method to add the Flex member to the OLAPSet instance, rather than the OLAPSet.addElements() method. This is because you are adding a single member to the axis, rather than multiple members.
The only issue with using the OLAPDimension.findMember() method is that it returns the first IOLAPMember instance in the cube that matches the String argument. If you think that you might have multiple instances of a member, you can rewrite this example to explicitly drill down through the cube by calling the OLAPDimension.findHierarchy(), OLAPHierarchy.findLevel(), and OLAPLevel.findMember() methods. This situation is more common with cubes that contain complex dimensions. For more information and examples, see Writing a query for a complex OLAP cube.
The OLAPLevel.findMember() method returns an IList instance that contains all IOLAPMember instances that match the String argument. You can then use the IList.getItemAt() method to access any element in the IList, as the following example shows:
  private function getQuery(cube:IOLAPCube):IOLAPQuery {
 	// Create an instance of OLAPQuery to represent the query.
 	var query:OLAPQuery = new OLAPQuery;

 	// Get the row axis from the query instance.
 	var rowQueryAxis:IOLAPQueryAxis = query.getAxis(OLAPQuery.ROW_AXIS);
 	// Create an OLAPSet instance to configure the axis.
 	var productSet:OLAPSet = new OLAPSet;
 	// Get the first IOLAPElement instance in the IList instance.
 	productSet.addElement(
 		IOLAPElement(cube.findDimension("ProductDim").findHierarchy("ProductHier").
 		findLevel("Product").findMember("Flex").getItemAt(0)));
 	rowQueryAxis.addSet(productSet);

 	var colQueryAxis:IOLAPQueryAxis = query.getAxis(OLAPQuery.COLUMN_AXIS);
 	var quarterSet:OLAPSet= new OLAPSet;
 	quarterSet.addElement(IOLAPMember(cube.findDimension("TimeDim").
 		findHierarchy("Month").findMember("January")));
 	quarterSet.addElement(IOLAPMember(cube.findDimension("TimeDim").
 		findHierarchy("Month").findMember("February")));
 	colQueryAxis.addSet(quarterSet);

 	return query;
 }
Writing a query for a complex OLAP cube
In a complex cube, at least one dimension of the schema contains multiple levels. For example, you have flat data that contains three fields:
  data:Object = {
 	product:"FlexJS"
 	year :"2006"
 	quarter :"Q1"
 	revenue: "100.00",
 }
The data fields of each record can contain the following values:
-
The product field can have the values: FlexJS, Flex, Installer, and TourDeFlex.
-
The year field can have the values: 2006 and 2007.
-
The quarter field can have the values: Q1, Q2, Q3, and Q4.
In this example, your schema defines two dimensions, with the TimeDim dimension containing levels for year and quarter, as the following code shows:
  <mx:OLAPCube name="FlatSchemaCube"
 	dataProvider="{flatData}"
 	id="myMXMLCube"
 	complete="runQuery(event);">

 	<mx:OLAPDimension name="ProductDim">
 		<mx:OLAPAttribute name="Product" dataField="product"/>
 		<mx:OLAPHierarchy name="ProductHier" hasAll="true">
 			<mx:OLAPLevel attributeName="Product"/>
 		</mx:OLAPHierarchy>
 	</mx:OLAPDimension>

 	<mx:OLAPDimension name="TimeDim">
 		<mx:OLAPAttribute name="Year" dataField="year"/>
 		<mx:OLAPAttribute name="Quarter" dataField="quarter"/>
 		<mx:OLAPHierarchy name="Time-PeriodHier" hasAll="true">
 			<mx:OLAPLevel attributeName="Year"/>
 			<mx:OLAPLevel attributeName="Quarter"/>
 		</mx:OLAPHierarchy>
 	</mx:OLAPDimension>

 	<mx:OLAPMeasure name="Revenue"
 		dataField="revenue"
 		aggregator="SUM"/>
 </mx:OLAPCube>
The cube has the following structure:
  ProductDim 							// Dimension
 	Product 							// Hierarchy
 		(All)							// Member
 		FlexJS 							// Member
 		Flex 							// Member
 		Installer 							// Member
 		TourDeFlex 							// Member

 	ProductHier 							// Hierarchy
 		(All) 							// Level
 			FlexJS 							// Member
 			Flex 							// Member
 			Installer 							// Member
 			TourDeFlex 							// Member

 		Product 							// Level
 			FlexJS 							// Member
 			Flex 							// Member
 			Installer 							// Member
 			TourDeFlex 							// Member

 TimeDim 							// Dimension
 	Year 							// Hierarchy
 		(All)							// Member
 		2006 							// Member
 		2007 							// Member

 	Quarter 							// Hierarchy
 		(All)							// Member
 		Q1 							// Member
 		Q2 							// Member
 		Q3 							// Member
 		Q4 							// Member

 	Time-PeriodHier 							// Hierarchy
 		(All) 							// Level
 			2006
 				Q1
 				Q2
 				Q3
 				Q4
 			2007
 				Q1
 				Q2
 				Q3
 				Q4

 		Year 							// Level
 			2006 							// Member
 			2007 							// Member

 		Quarter 							// Level
 			Q1 (having 2006 as a parent) 							// Member
 			Q1 (having 2007 as a parent) 							// Member
 			Q2 (having 2006 as a parent) 							// Member
 			Q2 (having 2007 as a parent) 							// Member
 			Q3 (having 2006 as a parent) 							// Member
 			Q3 (having 2007 as a parent) 							// Member
 			Q4 (having 2006 as a parent) 							// Member
 			Q4 (having 2007 as a parent) 							// Member
Notice in this cube:
-
The information for the quarter is added as a hierarchy under the TimeDim dimension, and as a level under the Time-PeriodHier hierarchy.
-
The Quarter level under the Time-PeriodHier hierarchy contains multiple entries for each quarter. In this example, there is an entry for each quarter for each year.
-
The order of the members, meaning the values along each dimension, is based on the order in which the member values appear in the flat data.
The reason for the multiple entries for a single quarter in the Quarter level under the Time-PeriodHier hierarchy is that a cube has to be able to return results for each quarter for each year. For example, this structure lets you write a query to return data aggregations for all quarters for all years, for all quarters for 2006, or for all quarters for 2007.
Since the ProductDim contains a single level, you can write queries for it in the same way as you did for a simple cube. See Writing a query for a simple OLAP cube for more information.
The following table shows the information returned for different ways to access the TimeDim by calling the findAttribute() method:
|
Reference to method and property |
Returns |
|---|---|
findDimension("TimeDim").findAttribute("Year").children
|
2006, 2007 |
findDimension("TimeDim").findAttribute("Year").members
|
(All), 2006, 2007 |
findDimension("TimeDim").findMember("2006")
|
2006 |
findDimension("TimeDim").findAttribute("Quarter").children
|
Q1, Q2, Q3, and Q4 |
findDimension("TimeDim").findAttribute("Quarter").members
|
(All), Q1, Q2, Q3, and Q4 |
findDimension("TimeDim").findMember("Q2")
|
Q2 having 2006 as a parent. This is the first instance of Q2 in the cube. |
The following table shows the information returned for different ways to use the OLAPDimension.findHierarchy(), OLAPHierarchy.findLevel(), and OLAPLevel.findMember() methods:
|
Reference to method and property |
Returns |
|---|---|
findDimension("TimeDim").findHierarchy("Time-PeriodHier"). findLevel("Year").children
|
2006, 2007 |
findDimension("TimeDim").findHierarchy("Time-PeriodHier"). findLevel("Year").members
|
(All), 2006, 2007 |
IOLAPElement(cube.findDimension("TimeDim"). findHierarchy("Time-PeriodHier").findLevel("Year"). findMember("2006").getItemAt(0))
|
2006 |
findDimension("QuarterDim").findHierarchy("QuarterHier"). findLevel("Quarter").children
|
Q1, Q2, Q3, and Q4 |
findDimension("QuarterDim").findHierarchy("QuarterHier"). findLevel("Quarter").members
|
(All), Q1, Q2, Q3, and Q4 |
findDimension("TimeDim").findHierarchy("Time-PeriodHier").findLevel("Quarter").findMember("Q1")
|
All Q1 members |
IOLAPElement(cube.findDimension("QuarterDim"). findHierarchy("QuarterHier").findLevel("Quarter"). findMember("Q2").getItemAt(0))
|
Q2 having 2006 as a parent. Cast the result to an instance of IOLAPElement because getItemAt() returns an Object. |
IOLAPElement(cube.findDimension("QuarterDim"). findHierarchy("QuarterHier").findLevel("Quarter"). findMember("Q2").getItemAt(1))
|
Q2 having 2007 as a parent. Cast the result to an instance of IOLAPElement because getItemAt() returns an Object. |
You could add a Month level to the TimeDim, as the following definition of TimeDim shows:
  <mx:OLAPDimension name="TimeDim">
 	<mx:OLAPAttribute name="Year" dataField="year"/>
 	<mx:OLAPAttribute name="Quarter" dataField="quarter"/>
 	<mx:OLAPAttribute name="Month" dataField="month"/>
 	<mx:OLAPHierarchy name="Time-PeriodHier" hasAll="true">
 		<mx:OLAPLevel attributeName="Year"/>
 		<mx:OLAPLevel attributeName="Quarter"/>
 		<mx:OLAPLevel attributeName="Month"/>
 	</mx:OLAPHierarchy>
 </mx:OLAPDimension>
For this example, the structure of the TimeDim dimension is:
  TimeDim 							// Dimension
 	Year 							// Hierarchy
 		(All)							// Member
 		2006 							// Member
 		2007 							// Member

 	Quarter 							// Hierarchy
 		(All)							// Member
 		Q1 							// Member
 		Q2 							// Member
 		Q3 							// Member
 		Q4 							// Member

 	Month 							// Hierarchy
 		(All)							// Member
 		Jan 							// Member
 		Feb 							// Member
 		... 							// Adiitional members for each month

 	Time-PeriodHier 							// Hierarchy
 		(All) 							// Level
 			2006
 				Q1
 					Jan
 					Feb
 					Mar
 				...
 			2007
 				Q1
 					Jan
 					Feb
 					Mar
 				...

 		Year 							// Level
 			2006 							// Member
 			2007 							// Member

 		Quarter 							// Level
 			Q1 (having 2006 as a parent) 							// Member
 			Q1 (having 2007 as a parent) 							// Member
 			Q2 (having 2006 as a parent) 							// Member
 			Q2 (having 2007 as a parent) 							// Member
 			Q3 (having 2006 as a parent) 							// Member
 			Q3 (having 2007 as a parent) 							// Member
 			Q4 (having 2006 as a parent) 							// Member
 			Q4 (having 2007 as a parent) 							// Member

 		Month 							// Level
 			Jan (having Q1 having 2006 as a parent) 							// Member
 			Feb (having Q1 having 2006 as a parent) 							// Member
 			Jan (having Q1 having 2007 as a parent) 							// Member
 			Feb (having Q1 having 2007 as a parent) 							// Member
 			...										// Additional members for each possible
 													// combination of month, quarter,
 													// and year
Notice in this cube:
-
The Month level contains a value for each month, and for each quarter for each year. Therefore, there should be two entries for January; one for Q1 of 2006 and one for Q1 of 2007.
Creating a multidimensional axis in an OLAPDataGrid control
The OLAPDataGrid control displays information along two axes: row and column. However, limiting yourself to writing queries that return only two dimensions can restrict your ability to examine your data.
To allow you greater flexibility in displaying query results, the OLAPDataGrid control supports hierarchical display along its axis. The following image shows quarterly sales information, grouped by year, displayed in the columns of the OLAPDataGrid control.
To create a multidimensional axis in the OLAPDataGrid control, you create two or more OLAPSet instances for the axis, and then combine the OLAPSet instances by doing a crossjoin or a union, as the following table describes:
|
Combination type |
OLAPSet method |
Description |
|---|---|---|
|
Crossjoin |
crossJoin() |
Creates a crossjoin of two OLAPSet instances, where a crossjoin contains all possible combinations of the two sets. A crossjoin is also called a cross product of the members of the two different sets. |
|
Union |
union() |
Creates a union of two OLAPSet instances. |
In the following example, you create an OLAPSet instance for the year, and then crossjoin that set with the OLAPSet instance for quarter to create the OLAPDataGrid control shown in the previous image:
  private function getQuery(cube:IOLAPCube):IOLAPQuery {
 	var query:OLAPQuery = new OLAPQuery;

 	var rowQueryAxis:IOLAPQueryAxis = query.getAxis(OLAPQuery.ROW_AXIS);
 	var productSet:OLAPSet = new OLAPSet;
 	productSet.addElements(
 		cube.findDimension("ProductDim").findAttribute("Product").children);
 	rowQueryAxis.addSet(productSet);

 	var colQueryAxis:IOLAPQueryAxis = query.getAxis(OLAPQuery.COLUMN_AXIS);
 	var yearSet:OLAPSet= new OLAPSet;
 	yearSet.addElements(
 		cube.findDimension("TimeDim").findAttribute("Year").children);
 	var quarterSet:OLAPSet= new OLAPSet;
 	quarterSet.addElements(
 		cube.findDimension("TimeDim").findAttribute("Quarter").children);
 	colQueryAxis.addSet(yearSet.crossJoin(quarterSet));

 	return query;
 }
Creating a slicer axis
An OLAP query can have three axes: row, column, and slicer. A slicer axis lets you reduce the size of the query results, often to reduce the dimensionality of the results from a dimension greater than two so that you can display the results. Another common use of a slicer axis is to aggregate data on a measure other than the default measure.
Creating a query using a nondefault measure
The following schema defines two measures for the points in the cube: Revenue and Cost. The first measure defined in the schema is the default measure, and it is the data that is aggregated by a query if you do not explicitly specify the measure.
  <mx:OLAPCube name="FlatSchemaCube"
 	dataProvider="{flatData}"
 	id="myMXMLCube"
 	complete="runQuery(event);">

 	<mx:OLAPDimension name="ProductDim">
 		<mx:OLAPAttribute name="Product" dataField="product"/>
 		<mx:OLAPHierarchy name="ProductHier" hasAll="true">
 			<mx:OLAPLevel attributeName="Product"/>
 		</mx:OLAPHierarchy>
 	</mx:OLAPDimension>

 	<mx:OLAPDimension name="QuarterDim">
 		<mx:OLAPAttribute name="Quarter" dataField="quarter"/>
 		<mx:OLAPHierarchy name="QuarterHier" hasAll="true">
 			<mx:OLAPLevel attributeName="Quarter"/>
 		</mx:OLAPHierarchy>
 	</mx:OLAPDimension>

 	<mx:OLAPMeasure name="Revenue"
 		dataField="revenue" aggregator="MAX"/>
 	<mx:OLAPMeasure name="Cost"
 		dataField="cost" aggregator="MIN"/>
 </mx:OLAPCube>
To aggregate by the Cost measure, you create a slicer axis to explicitly specify the measure for the query, as the following example shows:
  private function getQuery(cube:IOLAPCube):IOLAPQuery {
 	// Create an instance of OLAPQuery to represent the query.
 	var query:OLAPQuery = new OLAPQuery;

 	// Get the row axis from the query instance.
 	var rowQueryAxis:IOLAPQueryAxis = query.getAxis(OLAPQuery.ROW_AXIS);
 	// Create an OLAPSet instance to configure the axis.
 	var productSet:OLAPSet = new OLAPSet;
 	productSet.addElements(
 		cube.findDimension("ProductDim").findAttribute("Product").children);
 	rowQueryAxis.addSet(productSet);

 	var colQueryAxis:IOLAPQueryAxis = query.getAxis(OLAPQuery.COLUMN_AXIS);
 	var quarterSet:OLAPSet= new OLAPSet;
 	quarterSet.addElements(
 		cube.findDimension("TimeDim").findAttribute("Month").children);
 	colQueryAxis.addSet(quarterSet);

 	// Create the slicer axis.
 	var slicerQueryAxis:IOLAPQueryAxis = query.getAxis(OLAPQuery.SLICER_AXIS);
 	// Create an OLAPSet instance to configure the axis.
 	var costSet:OLAPSet= new OLAPSet;
 	// Use OLAPDimension.findMember() to add the Cost measure.
 	costSet.addElement(cube.findDimension("Measures").findMember("Cost"));
 	slicerQueryAxis.addSet(costSet);

 	return query;
 }
In this example, you use the keyword Measures to identify the measure dimension, and then use the OLAPDimension.findMember() method to access the Cost measure.
Using a slicer axis to reduce the dimensionality of the query result
The OLAPDataGrid control displays information in two dimensions along its row and column axis. However, to display product sales by region and by month, you require a three-dimensional display: one dimension each for product, region, and month.
For example, your data has the following format:
  data:Object = {
 	customer:"IBM",
 	country:"US",
 	state:"MA",
 	region:"NewEngland",
 	product:"FlexJS",
 	year:2005,
 	quarter:"Q1"
 	month:"January",
 	revenue: 12,575.00,
 	cost: 500
 }
The examples use the following OLAP schema to represent this data in an OLAP cube:
    <mx:OLAPCube name="FlatSchemaCube"
        dataProvider="{flatData}"
        id="myMXMLCube"
        complete="runQuery(event);">

        <mx:OLAPDimension name="CustomerDim">
            <mx:OLAPAttribute name="Customer" dataField="customer"/>
            <mx:OLAPHierarchy name="CustomerHier"
                hasAll="true">
                <mx:OLAPLevel attributeName="Customer"/>
            </mx:OLAPHierarchy>
        </mx:OLAPDimension>

        <mx:OLAPDimension name="ProductDim">
            <mx:OLAPAttribute name="Product" dataField="product"/>
            <mx:OLAPHierarchy name="ProductHier"
                hasAll="true">
                <mx:OLAPLevel attributeName="Product"/>
            </mx:OLAPHierarchy>
        </mx:OLAPDimension>

        <mx:OLAPDimension name="TimeDim">
            <mx:OLAPAttribute name="Year" dataField="year"/>
            <mx:OLAPAttribute name="Quarter" dataField="quarter"/>
            <mx:OLAPAttribute name="Month" dataField="month"/>
            <mx:OLAPHierarchy name="Time-Period"
                hasAll="true">
                <mx:OLAPLevel attributeName="Year"/>
                <mx:OLAPLevel attributeName="Quarter"/>
                <mx:OLAPLevel attributeName="Month"/>
            </mx:OLAPHierarchy>
        </mx:OLAPDimension>

        <mx:OLAPDimension name="GeographyDim">
            <mx:OLAPAttribute name="Country" dataField="country"/>
            <mx:OLAPAttribute name="Region" dataField="region"/>
            <mx:OLAPAttribute name="State" dataField="state"/>
            <mx:OLAPHierarchy name="Country-Region-State"
                hasAll="true">
                <mx:OLAPLevel attributeName="Country"/>
                <mx:OLAPLevel attributeName="Region"/>
                <mx:OLAPLevel attributeName="State"/>
            </mx:OLAPHierarchy>
        </mx:OLAPDimension>

        <mx:OLAPMeasure name="Revenue"
            dataField="revenue"
            aggregator="SUM"/>
        <mx:OLAPMeasure name="Cost"
         dataField="cost"
         aggregator="SUM"/>
    </mx:OLAPCube>
You can use a slicer axis to filter the results of a query for display in two dimensions. In this example, you set the row axis to the region and the column axis to the month. You then define a slicer axis to specify the product as Flex so that you end up with a two-dimensional table of sales by region and month for Flex.
  private function getQuery(cube:IOLAPCube):IOLAPQuery {
 	// Create an instance of OLAPQuery to represent the query.
 	var query:OLAPQuery = new OLAPQuery;

 	// Get the row axis from the query instance.
 	var rowQueryAxis:IOLAPQueryAxis = query.getAxis(OLAPQuery.ROW_AXIS);
 	// Create an OLAPSet instance to configure the axis.
 	var productSet:OLAPSet = new OLAPSet;
 	productSet.addElements(
 		cube.findDimension("GeographyDim").findAttribute("Region").children);
 	rowQueryAxis.addSet(productSet);

 	var colQueryAxis:IOLAPQueryAxis = query.getAxis(OLAPQuery.COLUMN_AXIS);
 	var quarterSet:OLAPSet= new OLAPSet;
 	quarterSet.addElements(
 		cube.findDimension("TimeDim").findAttribute("Month").children);
 	colQueryAxis.addSet(quarterSet);

 	// Create the slicer axis.
 	var slicerQueryAxis:IOLAPQueryAxis = query.getAxis(OLAPQuery.SLICER_AXIS);
 	// Create an OLAPSet instance to configure the axis.
 	var flexSet:OLAPSet= new OLAPSet;
 	flexSet.addElement(
 		IOLAPElement(cube.findDimension("ProductDim").findHierarchy("ProductHier").
 		findLevel("Product").findMember("Flex").getItemAt(0)));
 	slicerQueryAxis.addSet(flexSet);

 	return query;
 }
You can specify more than one member for the slicer access. For example, if your cube contains information on different product such as Flex and Adobe® Flash®, you could create the two slicer axes as the following example shows:
  // Create the slicer axis.
 var slicerQueryAxis:IOLAPQueryAxis = query.getAxis(OLAPQuery.SLICER_AXIS);

 // Create an OLAPSet instance to configure the axis.
 var sliceSet:OLAPSet= new OLAPSet;
 sliceSet.addElement(IOLAPElement(cube.findDimension("ProductDim").
 	findHierarchy("ProductHier").findLevel("Product").findMember("Flex").getItemAt(0)));

 sliceSet.addElement(IOLAPElement(cube.findDimension("ProductDim").
 	findHierarchy("ProductHier").findLevel("Product").findMember("Flash").getItemAt(0)));

 slicerQueryAxis.addSet(sliceSet);
In this example, your query result would show sales of Flex and Flash for each region and month.
Configuring the display of an OLAPDataGrid
To control the display of an OLAPDataGrid control, you can apply styles to the cells of the control by using a callback function, or use item renderers to control the display.
Styling cells of the OLAPDataGrid control by using a callback function
To control the styling of a cell by using a callback function, use the OLAPDataGrid.styleFunction property to specify the callback function. The callback function must have the following signature:
function_name(row:IOLAPAxisPosition, column:IOLAPAxisPosition, value:Number):Object
where row is the IOLAPAxisPosition associated with this cell on the row axis, column is the IOLAPAxisPosition associated with this cell on the column axis, and value is the cell value.
The function returns an Object that contains one or more styleName:value pairs to specify a style setting, or null. The styleName field contains the name of a style property, such as color, and the value field contains the value for the style property, such as 0x00FF00. For example, you could return two styles using the following syntax:
{color:0xFF0000, fontWeight:"bold"}
The OLAPDataGrid control invokes the callback function when it updates its display, such as when the control is first drawn on application start up, or when you call the invalidateList()method.
The following example modifies the example shown in the section Example using the OLAPDataGrid control to add a callback function to display all cells with a value greater than 1000 in green:
  <fx:Script>
 	<![CDATA[
 		...

 		// Callback function that hightlights in green
 		// all cells with a value greater than or equal to 1000.
 		public function myStyleFunc(row:IOLAPAxisPosition, column:IOLAPAxisPosition,
 			value:Number):Object
 		{
 			if (value >= 1000)
 			return {color:0x00FF00};

 			// Return null if value is less than 1000.
 			return null;
 		}
 		]]>
 </fx:Script>

 ...

 <mx:OLAPDataGrid id="myOLAPDG"
 	width="100%" height="100%"
 	styleFunction="myStyleFunc"/>
Using an item renderer with the OLAPDataGrid control
You customize the appearance and behavior of cells in an OLAPDataGrid control by creating custom item renderers.
For an introduction to item renderers and item editors, see MX item renderers and item editors.
To use an item renderer with the OLAPDataGrid control, you assign the item renderer to the OLAPDataGrid control itself, not to a specific column, by using the OLAPDataGrid.itemRendererProviders property. The itemRendererProviders property contains an Array of OLAPDataGridItemRendererProvider instances, where each OLAPDataGridItemRendererProvider instance defines the characteristics for a single item renderer.
You can use the OLAPDataGridRendererProvider.renderer property to assign an item renderer to the OLAPDataGrid control, much in the way that you can by using the AdvancedDataGrid.rendererProviders property, or can use the OLAPDataGridRendererProvider.formatter property to assign a formatter class. The following example modifies the example shown in the section Example using the OLAPDataGrid control to add an item renderer that applies the CurrencyFormatter formatter to each cell in the control:
  ...
 <mx:CurrencyFormatter id="usdFormatter" precision="2"
 	currencySymbol="$" decimalSeparatorFrom="."
 	decimalSeparatorTo="." useNegativeSign="true"
 	useThousandsSeparator="true" alignSymbol="left"/>

 ...

 <mx:OLAPDataGrid id="myOLAPDG"
 	width="100%" height="100%">

 	<mx:itemRendererProviders>
 		<mx:OLAPDataGridItemRendererProvider
 			uniqueName="[QuarterDim].[Quarter]"
 			type="{OLAPDataGrid.OLAP_HIERARCHY}"
 			formatter="{usdFormatter}"/>
 	</mx:itemRendererProviders>
 </mx:OLAPDataGrid>
To assign the item renderer, use the uniqueName and type properties of the OLAPDataGridItemRendererProvider class. The uniqueName property specifies the elements of the query, and therefore the corresponding cells of the OLAPDataGrid control, that you modify by using the item renderer. The type properly specifies the element type, such as dimension, hierarchy, or level of the element specified by the uniqueName property.
When assigning a formatter to the OLAPDataGridItemRendererProvider, you must specify a subclass of the mx.formatters.Formatter class; for example, the MX formatters such as CurrencyFormatter or NumberFormatter. The formatter cannot be a Spark formatter.
The function that defines the query for this example is shown below:
  // Create the OLAP query.
 private function getQuery(cube:IOLAPCube):IOLAPQuery {
 	// Create an instance of OLAPQuery to represent the query.
 	var query:OLAPQuery = new OLAPQuery;

 	// Get the row axis from the query instance.
 	var rowQueryAxis:IOLAPQueryAxis = query.getAxis(OLAPQuery.ROW_AXIS);
 	// Create an OLAPSet instance to configure the axis.
 	var productSet:OLAPSet = new OLAPSet;
 	// Add the Product to the row to aggregate data
 	// by the Product dimension.
 	productSet.addElements(
 		cube.findDimension("ProductDim").findAttribute("Product").children);
 	// Add the OLAPSet instance to the axis.
 	rowQueryAxis.addSet(productSet);

 	// Get the column axis from the query instance, and configure it
 	// to aggregate the columns by the Quarter dimension.
 	var colQueryAxis:IOLAPQueryAxis = query.getAxis(OLAPQuery.COLUMN_AXIS);
 	var quarterSet:OLAPSet= new OLAPSet;
 	quarterSet.addElements(
 		cube.findDimension("QuarterDim").findAttribute("Quarter").children);
 	colQueryAxis.addSet(quarterSet);

 	return query;
 }
Notice that the axis for the QuarterDim creates a query for the Quarter hierarchy of the QuarterDim dimension. Therefore, you set the uniqueName property to [QuarterDim].[Quarter], and set the type property to OLAPDataGrid.OLAP_HIERARCHY. For more information on the structure of the OLAP code for this example, see Writing a query for a simple OLAP cube.
You can modify this example to drill down through the cube by specifying the query as shown below for the QuarterDim:
  quarterSet.addElements(
 	cube.findDimension("QuarterDim").findHierarchy("QuarterHier").
 	findLevel("Quarter").members);
You therefore modify the uniqueName and type properties as shown below:
  <mx:OLAPDataGrid id="myOLAPDG"
 	width="100%" height="100%">

 	<mx:itemRendererProviders>
 		<mx:OLAPDataGridItemRendererProvider
 			uniqueName="[QuarterDim].[QuarterHier].[Quarter]"
 			type="{OLAPDataGrid.OLAP_LEVEL}"
 			formatter="{usdFormatter}"/>
 	</mx:itemRendererProviders>
 </mx:OLAPDataGrid>
Notice in this example that the query for the QuarterDim specifies the dimension, hierarchy, and level of the OLAP cube. Therefore, you modify the uniqueName property to match this structure, and set the type property to OLAPDataGrid.OLAP_LEVEL.
Resolving item renderer conflicts
Each cell in an OLAPDataGrid control is a result of an intersection between the members along a row and the members along a column of the control. However, when you assign an item renderer to an OLAPDataGrid control, you only specify the uniqueName and type properties for one of the dimensions, either row or column. Therefore, you can create a situation where two different item renderers are assigned to the same cell of the control.
In case of a conflict between two or more item renderers, the OLAPDataGrid control applies the item renderer based on the following priorities:
-
type = OLAPDataGrid.OLAP_MEMBER
-
type = OLAPDataGrid.OLAP_LEVEL
-
type = OLAPDataGrid.OLAP_HIERARCHY
-
type = OLAPDataGrid.OLAP_DIMENSION
Therefore, if an item renderer with a type value of OLAPDataGrid.OLAP_LEVEL and an item renderer with a type value of OLAPDataGrid.OLAP_HIERARCHY are applied to the same cell, the OLAPDataGrid control applies the item renderer with a type value of OLAPDataGrid.OLAP_LEVEL.
If two item renderers have the same value for the type property, the OLAPDataGrid control determines which renderer more closely matches the item, and uses it.
Using an item renderer to apply styles to an OLAPDataGrid control
You can use an item renderer to apply styles to specific cells in the OLAPDataGrid control, as the following example shows:
  <fx:Style>
 	.cellStyle
 	{
 		color:#ff0000;
 		fontWeight:"bold"
 	}
 </fx:Style>

 	...

 <mx:OLAPDataGrid id="myOLAPDG"
 	width="100%" height="100%">

 	<mx:itemRendererProviders>
 		<mx:OLAPDataGridItemRendererProvider
 			uniqueName="[QuarterDim].[Quarter]"
 			type="{OLAPDataGrid.OLAP_HIERARCHY}"
 			formatter="{usdFormatter}"
 			styleName="cellStyle"/>
 	</mx:itemRendererProviders>
 </mx:OLAPDataGrid>
In this example, you create a style definition, then apply it to the cells of the OLAPDataGrid control so that it applies to the same cells as the CurrencyFormatter formatter.
Navigation
Adobe and Adobe Flash are either registered trademarks or trademarks of Adobe Systems Incorporated in the United States and/or other countries and are used by permission from Adobe. No other license to the Adobe trademarks are granted.